4. Diagnosis: insights on sustainability regarding campus life
Vasile Gherheș, Mariana Cernicova-Bucă, Gabriel-Mugurel Dragomir and Adina Palea
4.1. Awareness and sustainable practices specific to the young generation
In Romania, most universities provide accommodation in dormitories as a means of facilitating access to education for wide categories of youth. At UPT, students pay a flat rental fee, regardless of consumption of utilities, at a reduced tariff, part of the accommodation costs being subsidized by the university. The dormitories have communal laundries equipped with washing machines and communal kitchens equipped with electric hobs. There are refrigerators in each room, and students bring with them portable appliances and devices such as laptops, hair dryers, irons, water heaters, TV screens, fans, etc. Municipal services provide utilities (water supply and waste management). Electricity is provided by specialized suppliers designated under national regulations. Most thermal energy comes from gas boilers, provided by the university.
The sociological inquiry played a key role in observing and studying the behavioral dynamics of students concerning energy consumption The data allowed researchers to have a complex and nuanced picture, contributing to the development of more effective policies and practices of energy resource management within the university. The research focused on the campus of Politehnica University Timisoara, Romania. Out of approximately 13,000 students studying at Politehnica, more than 6,000 opt to live on campus. Of the 16 student dormitories, two were excluded from the study because they are reserved for faculty and doctoral students, who differ from most campus residents by age, professional and financial status, space occupancy and length of lease.
The research team used the sociological questionnaire as a tool for data collection. Questionnaires are frequently used to gather data on energy consumption, as shown by studies conducted by Deme Belafi et al. (Belafi, 2018). In formulating the questions, the research team drew inspiration from both the scientific literature and from the set of questions developed by the World Bank and the World Health Organization to measure the use of the world’s energy resources (Core Questions for Household Energy Use, n.d.; Special Eurobarometer 513: Climate Change – Data Europa EU, n.d.; Debrah et al., 2021; Gherheș et al., 2021; Gherheș & Fărcașiu, 2021). The questionnaire allowed not only to identify the frequency of use of electrical appliances, but also to deeply analyze attitudes and perceptions related to energy and water consumption, waste management and other practices which bear an effect on sustainable housing. Special emphasis was placed on students’ awareness of the impact of their actions on energy consumption and on their strategies to minimize energy costs and reduce their environmental impact. The questionnaire included questions that rated the frequency of certain behaviors on a scale from 1 (“never”) to 6 (“daily”), with option 7 allowing for non-response, rated 0. Environmental behaviors were measured on a 5-point Likert scale, from 1 (“never”) to 5 (“always”). The questionnaire ends with a set of socio-demographic questions regarding the age, gender, and residence status of the participants.
To ensure the validity of the questionnaire, the Cronbach Alpha coefficient was calculated on a test sample. Cronbach’s alpha quantifies the level of agreement on a standardized 0 to 1 scale (Cronbach – 1990 – Essentials of Psychological Testing, n.d.). Higher values indicate higher agreement between items, proving the reliability and internal consistency of the questionnaire (Howitt & Cramer, 2008; Tabachnick et al., 2013). The Cronbach Alpha coefficient for the created questionnaire indicated values above 0.7, which is considered acceptable for research (Tabachnick et al., 2013), indicating a solid internal consistency of the selected elements and facilitating the performance of factorial analyses.
To pursue the goal of determining energy consumption and student behavior, it was essential to create a balanced and representative sample. To this end, the research team chose to distribute the questionnaire through a method that maximizes participation and ensures diversity of responses. The questionnaire was disseminated online, using the online communication channels of administrators and student representatives in dormitories (heads of dormitory or floor), who are in direct and constant contact with students residing on campus. They have direct access to each dorm’s WhatsApp groups, which function as primary communication platforms for student announcements and discussions. The use of these groups allowed the questionnaire to be disseminated quickly and efficiently, thus ensuring that it reached many students in a relatively short time. In addition, this method also facilitated a higher response rate, since students tend to be more receptive to information distributed through familiar and trusted channels.
In addition, to expand the coverage and to ensure the demographic diversity within the sample, the link to complete the questionnaire was also distributed through the communication networks of the university’s 10 student leagues. These leagues, representing different faculties and academic interests, have their own communication channels and social network accounts, used to engage students in various activities and initiatives. By accessing these channels, the research team was able to reach diverse segments of the student population, from newcomers to doctoral students, each with potentially different energy consumption behaviors.
The direct and personalized approach in communicating with students has improved the level of involvement and their interest in participating in the survey, thus increasing the quality and accuracy of the obtained data. In the end, a number of 1023 students from the Politehnica University of Timisoara, coming from all years of study, participated in the study. Since the university schools approximately 13,000 students, the calculated margin of error was ±3.3%. Participation was voluntary and measures were adopted to protect respondents’ confidentiality.
Starting from the premise that students are not only participants in the educational process, but also actors in a university ecosystem that promotes sustainability and responsible management of resources, this study aimed to assess to what extent student behavior influences and reflects sustainability principles applied to campus life. Focusing on various aspects of daily life in student dormitories, the research aimed to identify and analyze efficient practices and possible areas for improvement.
The objectives of the study were:
• To investigate students’ perceptions and behaviors related to environmental protection and to identify the factors that influence these attitudes;
• To analyze electricity consumption management practices in UPT dormitories;
• To define electricity saving behaviors in UPT student dormitories;
• To investigate water saving behaviors in UPT student dormitories;
• To study waste management behaviors and practices, including waste sorting and disposal techniques in UPT student dormitories;
• To examine recycling practices in UPT student dormitories;
• To analyze the integration of ecological practices into students’ daily routine and in their educational environment;
• To investigate the ways in which students contribute to resource conservation and environmental protection.
The results of the sociological study, corroborated with the monitoring of electricity, heat and water consumption in dormitories (based on consumption records, but also on the invoices issued by suppliers) allowed the creation of a profile of the student-consumer of household utilities, which was the basis of the transformative intervention, set as the main objective of the project (Cernicova-Bucă et al., 2024 a). In summary, the research approach is represented as follows:

Figure 1. Conceptual design of research
The described approach created the possibility of accumulating a rich pool of data, which allowed a data-driven design of the campaigns aimed at influencing behaviors and the elaboration of information and persuasive messages tailored for the purposes stated as pertaining to the project.
The detailed sections below present the results of the survey. Each section reflects a specific aspect of students’ sustainable behaviors and practices, from managing energy consumption to active involvement in environmental protection.
1. Awareness and action: perspectives and commitments of students from the dormitories of Politehnica University of Timișoara (UPT) regarding environmental protection
The section contains information on:
- Awareness of environmental protection issues
- Importance attached to environmental protection
- Concerns about environmental issues
- Individual actions for environmental protection
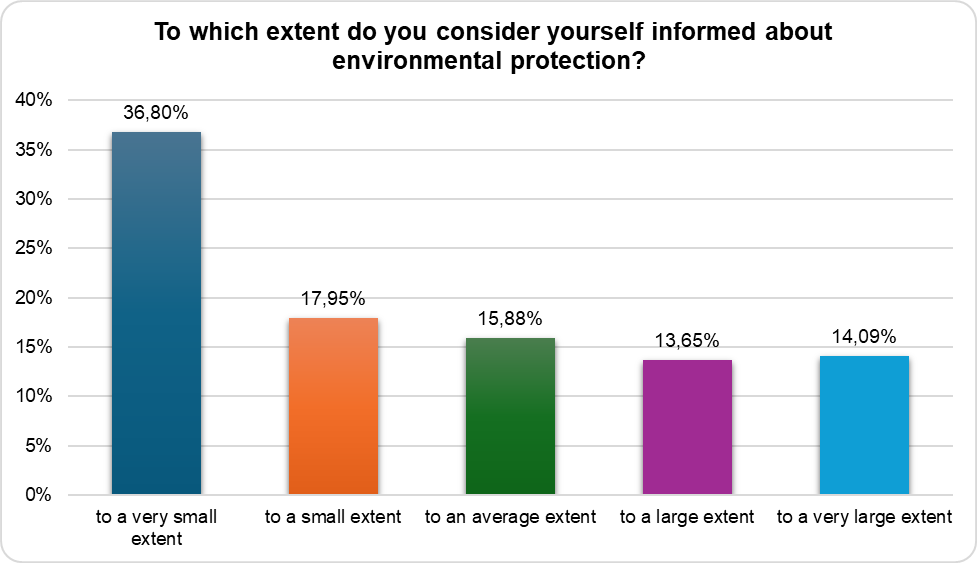
Figure 1.1. Degree of information concerning environmental protection

Figure 1.2. Importance attached to environmental protection

Figure 1.3. Concerns about environmental issues (I)
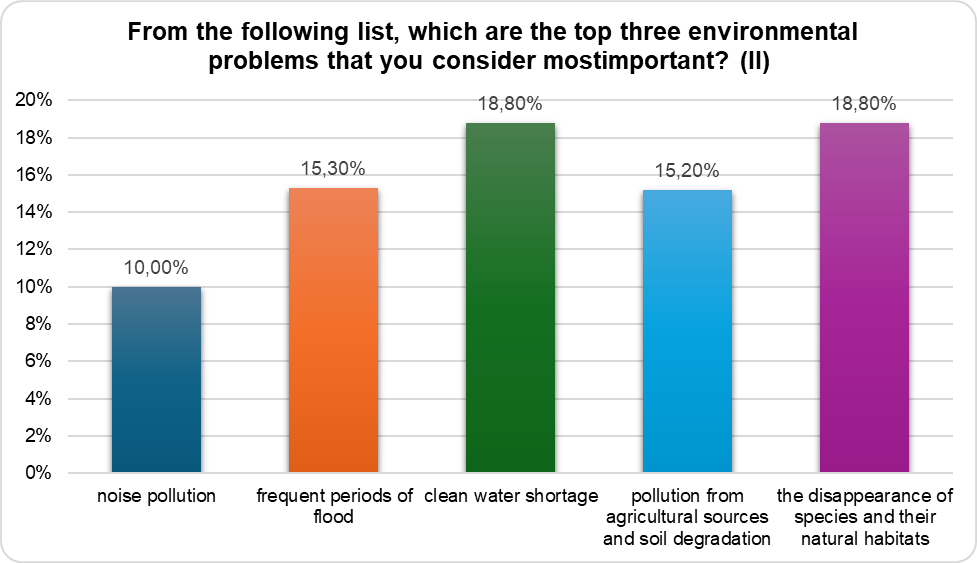
Figure 1.4. Concerns about environmental issues (II)

Figure 1.5. Individual actions for environmental protection (I)
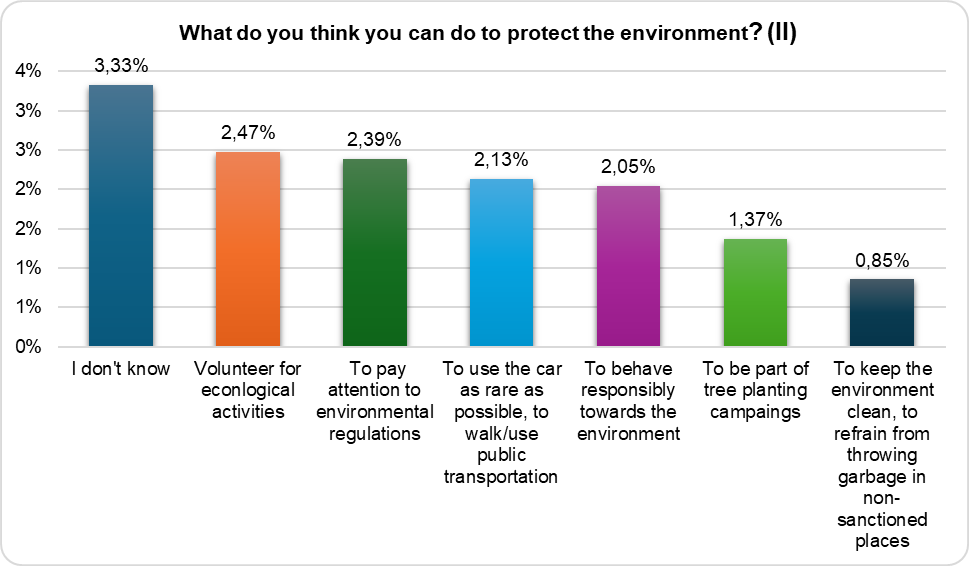
Figure 1.6. Individual actions for environmental protection (II)
Results in brief
Awareness of environmental protection:
• Most respondents (43.3%) consider themselves informed to an average extent about environmental protection. A significant proportion of the sample (30.3%) feel informed regarding environmental protection to a large extent, and 12.1% to a very large extent, suggesting that there is a well-informed and possibly active group in the field of environmental protection. A smaller minority (3.8% to a very small extent and 10.5% to a small extent) consider themselves poorly informed.
Importance given to environmental protection:
• Most respondents consider environmental protection to be quite important (53.5%) or very important (42.2%), reflecting a high value placed on this aspect. Only a small fraction of the sample considers environmental protection to be not at all important (0.4%) or not too important (3.9%), suggesting that almost all participants attach some level of importance to environmental protection.
Perception of environmental issues:
• Air pollution is considered to be one of the most important environmental problems, with 62.5% of respondents selecting this option. Increased amounts of waste are also of major concern, with 61.9% of respondents considering the issue to be important. Deforestation is identified as a key issue by 56.8% of participants.
• Other environmental issues, such as climate change (49.8%), are also recognized as significant, but to a somewhat lesser extent compared to the first three.
• Issues such as marine pollution, pollution of rivers, lakes and groundwater, and drinking water scarcity are also receiving significant attention, reflecting an awareness of the importance of clean water and aquatic ecosystems for human health and the environment.
• By contrast, noise pollution, frequent periods of floods and droughts, and pollution from agricultural sources and soil degradation are considered less important compared to other environmental problems.
Perceptions and actions for environmental protection:
• Separate collection of recyclables and recycling are the most frequently mentioned concrete actions that people believe they can undertake to protect the environment, each with about 15.6% and 15.4%.
• Other actions mentioned include trying to pollute as little as possible and be more responsible (7.7%), throwing garbage in specially designated places (7.5%), informing other people (4.27%), responsible consumption to avoid waste (3.8%).
• Volunteering for greening actions (2.5%) and participating in tree planting campaigns (1.4%) are also recognized as valuable contributions, although they are mentioned less frequently.
• Interesting to note is the fact that 4.3% of respondents see informing others about environmental protection as an important action, indicating that students believe in the power of education and awareness in promoting behavior change.
• A small percentage of respondents (3.67%) believe they can do nothing to protect the environment, and a significant proportion of respondents (27.47%) did not provide a specific answer, which may indicate uncertainty, lack of awareness or indifference to individual environmental protection actions.
Associated research
While the data in this section highlight the awareness of on-campus students with respect to environmental issues and their readiness for action, a whole-institution approach needs to also analyze the students who have different living arrangements (living with parents, renting independently, etc.). Such a view is offered by the article Cernicova-Buca, Mariana, Gabriel-Mugurel Dragomir, Vasile Gherheș, and Adina Palea. 2023. “Students’ Awareness Regarding Environment Protection in Campus Life: Evidence from Romania” Sustainability 15, no. 23: 16444. https://doi.org/10.3390/su152316444. The article presents the influence of place of residence and gender on the students’ perceptions and behaviors and helps visualize the specificity of this major stakeholder that cannot be dealt with as a monolith. A genuine transformative effort needs to acknowledge the differences and propose directions for action tailored according to students’ interests, predispositions, and knowledge.
2. Awareness and sustainable practices: managing electricity consumption in UPT dormitories
The section contains information on:
- Attention paid to energy consumption
- Level of information about energy consumption of the electric appliances
- Frequency of use of the refrigerator
- Frequency of use of the washing machine
- Frequency of use of the electric hob
- Frequency of use of the iron
- Frequency of use of hair dryer
- Frequency of use of computer/laptop/printer
- Frequency of use of air conditioning
- Frequency of use of the electric radiator
- Frequency of use of the dishwasher
- Frequency of use of the vacuum cleaner
- Frequency of use of the hair straightener/curling plate
- Frequency of use of the electric kettle
- Frequency of use of the toaster

Figure 2.1. Attention paid to energy consumption

Figure 2.2. Level of information about energy consumption of the electric appliances
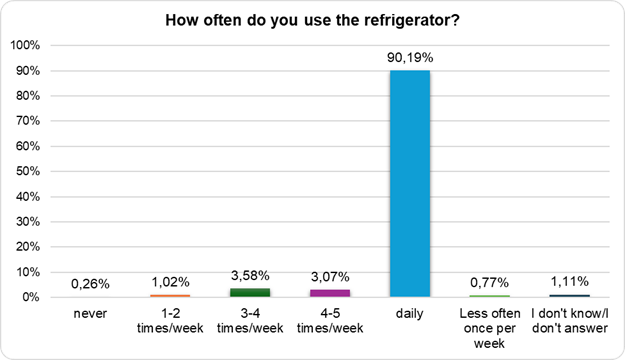
Figure 2.3. Frequency of use of the refrigerator

Figure 2.4. Frequency of use of the washing machine
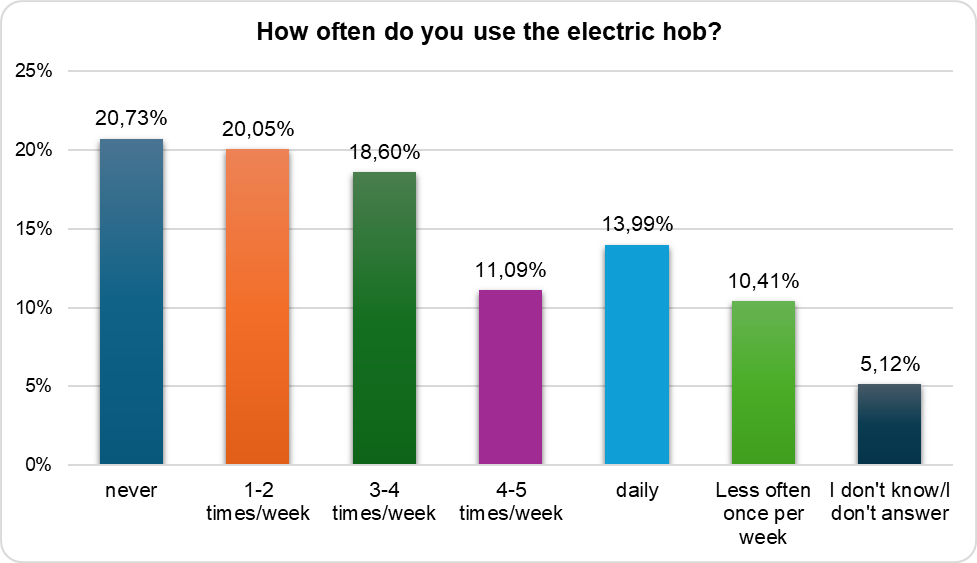
Figure 2.5. Frequency of use of the electric hob

Figure 2.6. Frequency of use of the iron
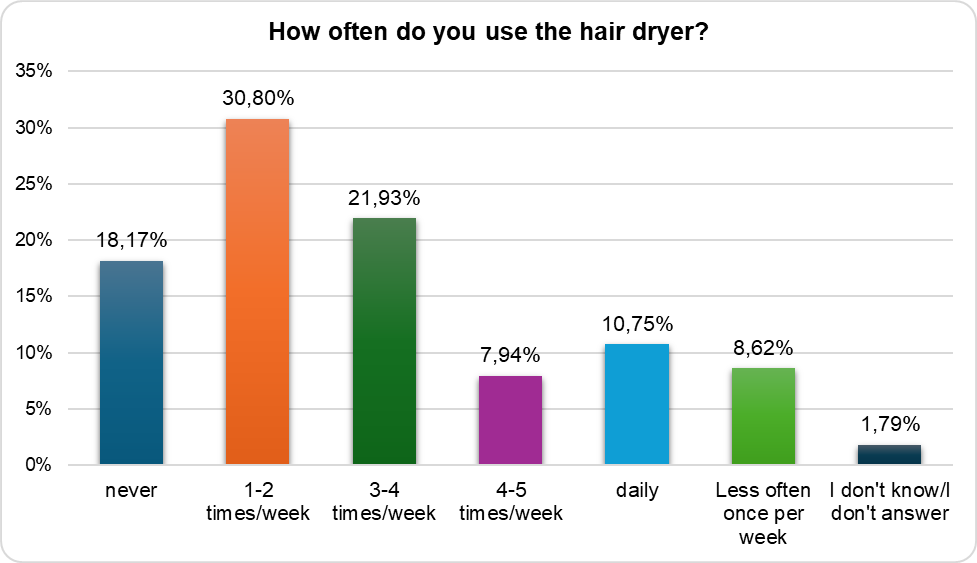
Figure 2.7. Frequency of use of the hair dryer
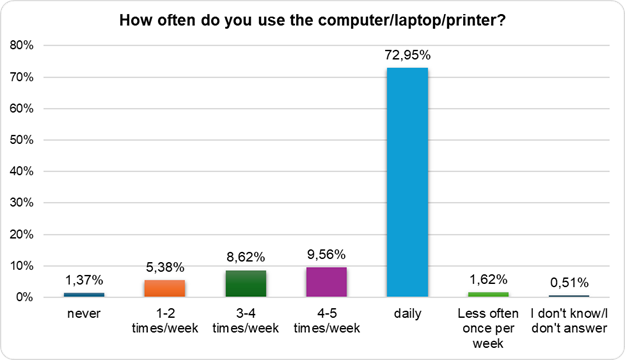
Figure 2.8. Frequency of use of the computer/laptop/printer

Figure 2.9. Frequency of use of the air conditioning
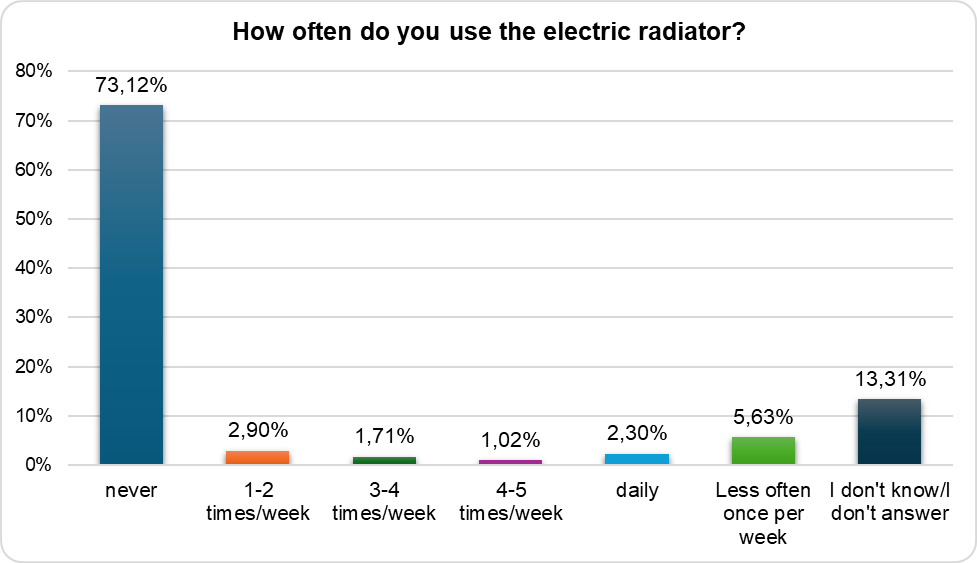
Figure 2.10. Frequency of use of the electric radiator

Figure 2.11. Frequency of use of the dishwasher
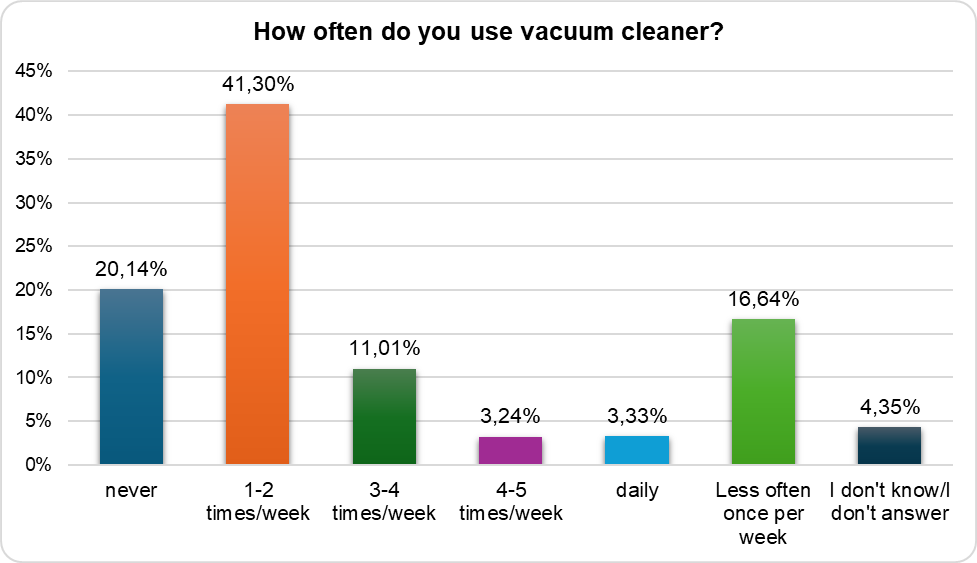
Figure 2.12. Frequency of use of the vacuum cleaner

Figure 2.13. Frequency of use of the hair straightener/curler

Figure 2.14. Frequency of use of the electric kettle

Figure 2.15. Frequency of use of the toaster
Results in brief
Attention paid to energy consumption:
• Most respondents, 43.3%, pay attention to energy consumption to an average extent. A significant proportion, 33.4%, are largely attentive, and 12.5% declare that they pay attention to a very large extent to the consumption of water, electricity, heat, etc.
• A small minority of respondents, 2.6%, indicate that they pay attention to energy consumption to a very small extent, and 8.4% that they pay attention to their consumption behaviors to a small extent.
Level of information about energy consumption of the electric appliances:
• A total of 20.5% of participants (4.9% to a very small extent and 15.6% to a small extent) consider themselves little or not informed at all about the energy consumption of the appliances they use.
• Most respondents, 38.0%, consider themselves informed to an average extent, indicating a general awareness of the importance of energy consumption, but possibly without a deep or detailed understanding of the energy specifications of their appliance.
• A significant proportion of 31.6% feel largely informed and 9.9% very largely informed, reflecting a segment of the population that is well informed and probably pays close attention to choosing and using energy-efficient appliances.
Frequency of use of household appliances:
1. Refrigerator:
• The overwhelming majority of respondents (90.2%) use the refrigerator daily, reflecting its status as an essential appliance in households.
2. Washing machine:
• Most respondents (61.2%) declare they use the washing machine 1–2 times a week, indicating regular, but not daily, use.
3. Electric hob:
• The use of this appliance is more evenly distributed, with 20.7% of respondents never using it and 20.1% using it 1–2 times a week.
4. Iron:
• A significant proportion (24.3%) never use an iron, and 29.6% of respondents declare they use it 1–2 times a week.
5. Hairdryer:
• The distribution is varied, with 18.2% of respondents never using it and 30.8% using it 1–2 times a week.
6. Computer/laptop/printer:
• A large majority (73%) of respondents use these devices daily, highlighting the importance of IT equipment in student everyday life.
7. Air conditioning:
• Most respondents (60.8%) never use air conditioning in living spaces.
8. Electric radiator:
• An overwhelming majority (73.1%) never use an electric radiator.
9. Dishwasher:
• Similar to the electric radiator, a large majority of respondents (73.3%) never use the dishwasher.
10. Vacuum cleaner:
• The use of this cleaning appliance is more common, with 41.3% of respondents stating that they use it 1–2 times a week.
11. Hair straightener/curling board:
• The majority (58.4%) never use this device, indicating limited use or specific personal care preferences.
12. Electric kettle:
• More than half of respondents (51.5%) never use this device, which may reflect different consumption habits or preferences for other methods of heating water.
13. Toaster:
• Almost half of respondents (48.1%) never use the toaster, showing that it is not considered essential by students in the sample.
3. Electricity saving behaviors in the UPT student dormitories
The section contains information on:
- Turning off the light when leaving the room
- Electric energy consumption habits while watching TV
- Preference for low-energy bulbs
- Preference for laundry drying
- Disconnecting electrical appliances when not in use
- Keeping the TV turned on
- Use of natural light in rooms
- Setting the temperature of the air conditioner relative to the outside one
- Regulation of heater temperature
- Adjusting the temperature in the room
- Attention to the light bulbs’ average lifetime hours
- Preference for low-energy household appliances
- Using power saving mode on the mobile phone

Figure 3.1. Behavior related to turning the light off upon leaving the room
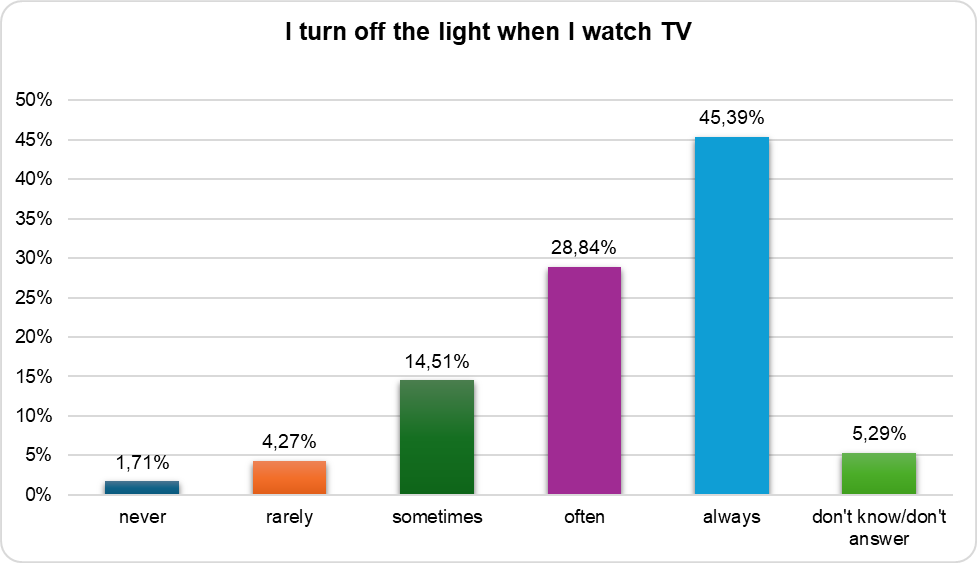
Figure 3.2. Electric energy consumption habits while watching TV

Figure 3.3. Preference for low-energy bulbs
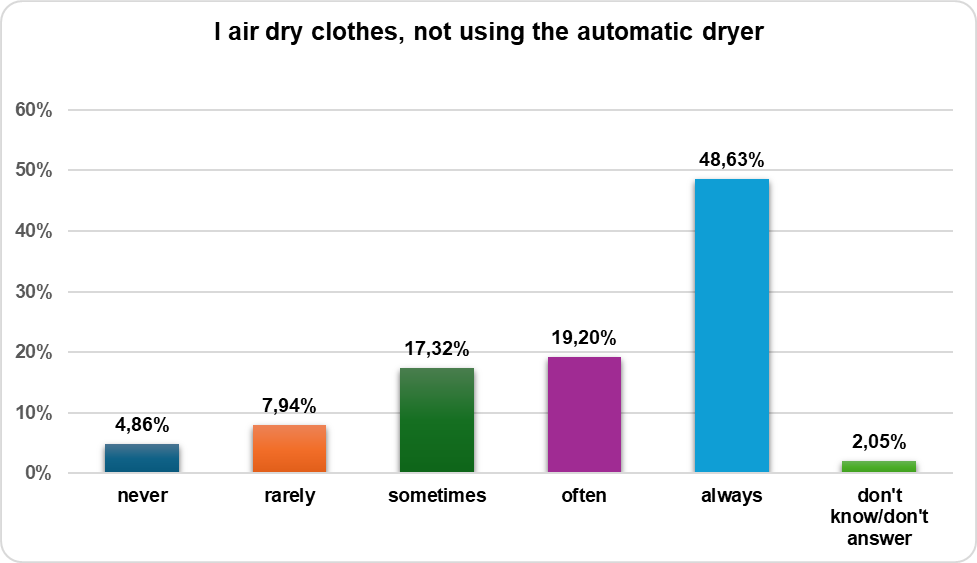
Figure 3.4. Preference for laundry drying

Figure 3.5. Disconnecting electrical appliances when not in use
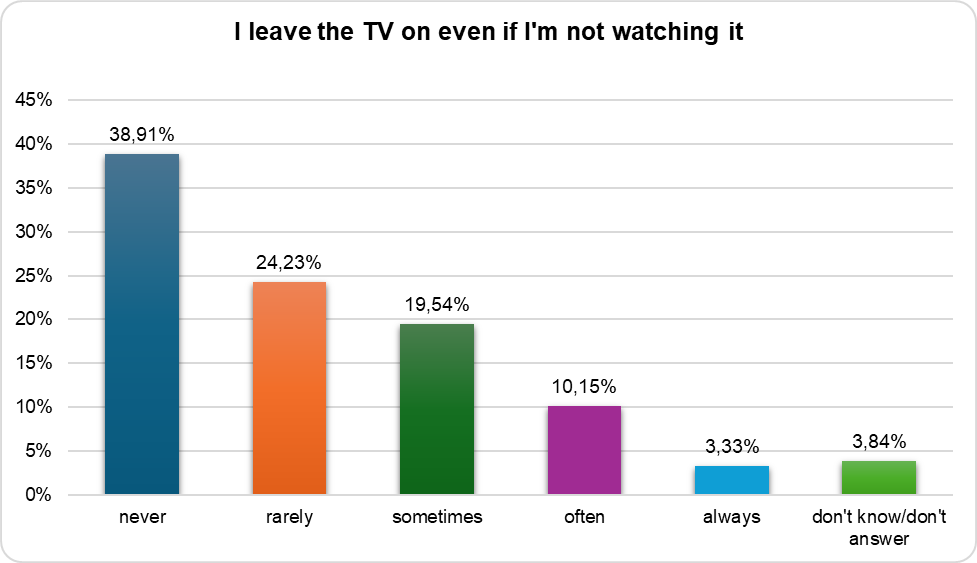
Figure 3.6. Keeping the TV turned on

Figure 3.7. Use of natural light in rooms

Figure 3.8. Setting the temperature of the air conditioner relative to the outside one

Figure 3.9. Setting the temperature in the room and using warner clothing, if necessary

Figure 3.10. Adjusting the temperature in the room
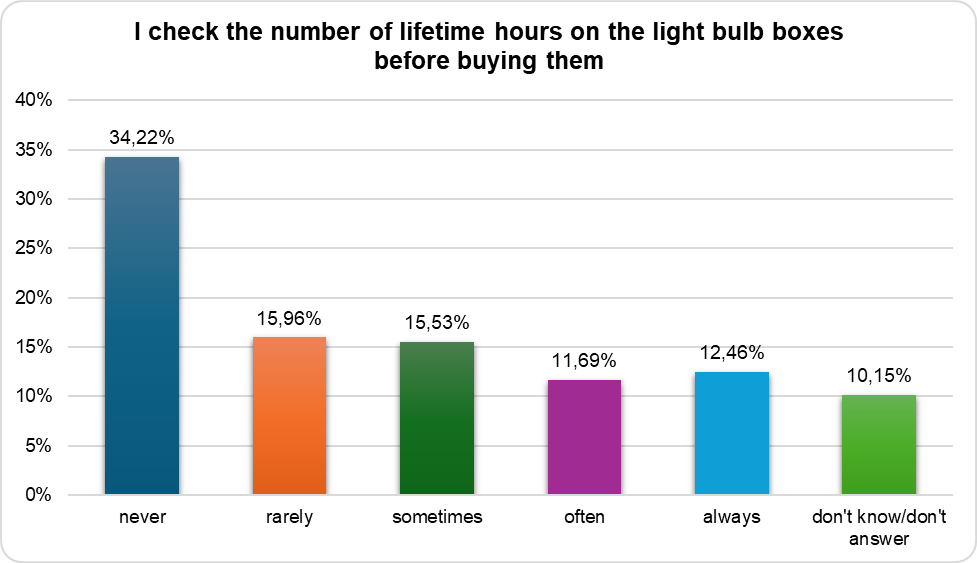
Figure 3.11. Attention to the light bulbs’ average lifetime hours

Figure 3.12. Preference for low-energy household appliances
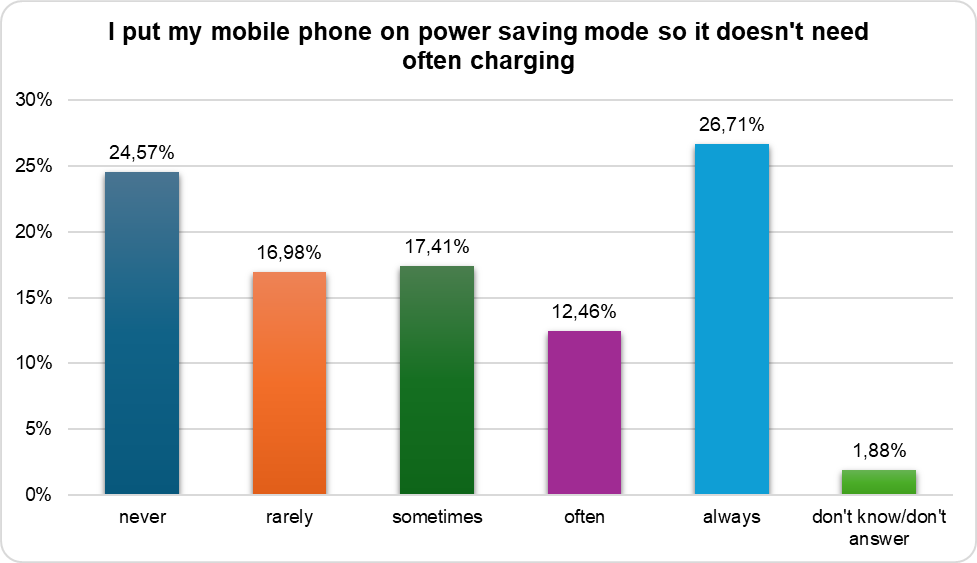
Figure 3.13. Using power saving mode on the mobile phone
Results in brief
1. Turning off the light when leaving the room:
• The majority of respondents (74.3%) say they always turn off the lights when leaving a room, indicating a high level of awareness and action to save electric energy.
2. Turning off the lights when watching TV:
• About half (45.4%) of study participants always turn off the lights while watching TV, suggesting a common practice of reducing electric energy consumption.
3. Replacing classic bulbs with energy-efficient ones:
• A significant proportion of subjects (37.5%) adopted low-energy bulbs as standard, reflecting a positive trend towards more sustainable lighting solutions.
4. Air drying laundry instead of using an automatic dryer:
• Almost half (48.6%) of participants prefer to air dry the laundry, demonstrating a preference for environmentally friendly drying methods.
5. Unplugging unused electrical and electronic appliances:
• More than a quarter of the respondents (27.7%) always do this, indicating an awareness of the “phantom” electric energy consumption. However, there are two categories of respondents who require special attention: those who “never” (12%) and those who “rarely” (15.9%) adopt this energy-saving behavior.
6. Keeping the TV on, even if no one watches it:
• A large proportion of the respondents (38.9%) never let their TV run unless they are watching it, indicating an energy-saving behavior. A minority of the students choose to maintain this behavior more frequently: 10.2% of the respondents indicate that they do this often, while 3.3% say they always leave the TV on, even when they are not present in the room.
7. Maximizing the use of natural light:
• An impressive majority (59.7%) of study participants always open blinds to let natural light into the room, highlighting a clear preference for natural over artificial lighting.
8. Air conditioning temperature setting:
• A notable proportion of respondents choose not to follow the recommendation to maintain the temperature difference from the outside at no more than 10 degrees. 23.9% of participants indicate that they never set the air conditioning according to this practice, while 7.9% of them rarely do so.
9. Regulation of heater temperature:
• 22.3% of those surveyed always set the heater temperature to an energy-efficient level, indicating good practices, but leaving room for improvement. At the opposite pole there is a cumulative proportion of 21.6% of respondents who indicate that they never or rarely follow this recommended practice for energy efficiency and sustainability.
10. Regulation of radiator temperature:
• About a quarter (23.8%) of the surveyed students always regulate the temperature through the radiator faucet if it is too hot, showing a conscious approach to heat management. The results show that a quarter of participants (26.1%) choose not to adjust or adjust the temperature only rarely through the radiator faucet when they consider it too hot in the room (by cumulating the answer options never (18.5%) and rarely (7.6%).
11. Checking the lifetime hours of the electric bulbs:
• A significant proportion of respondents do not pay special attention to this aspect. 34.2% of participants indicate that they never check this information, while 16.0% of them rarely do so. These data suggests that half of respondents (50.2%) do not place much emphasis on the durability of bulbs at the time of purchase, which may reflect a lack of awareness of the long-term impact of choosing more energy-efficient bulbs.
12. Choice of appliances with low energy consumption:
• There is a relatively equal distribution between different behaviors, with 20.6% of people surveyed always energy-efficient appliances. A combined proportion of 26.5% of participants (14.3% never and 12.2% rarely) do not prioritize energy efficiency when making such purchases.
13. Using power saving mode on mobile devices:
• About a quarter (26.7%) of the students in the sample always use energy saving mode on their mobile phones, indicating a growing awareness of the importance of saving energy even in using small devices. However, 41.6% of respondents (24.6% never and 17.0% rarely) do not activate this function to reduce the frequency of charging operations.
Associated research
Modern life depends on the availability of electric energy but, as UN reports show, prioritizing energy efficiency in policy and increasing investment are needed to achieve energy and climate targets. Otherwise “the 2030 Agenda will become an epitaph for a world that might have been” as António Guterres, UN Secretary-General remarked. Recent research shows that residential sector energy consumption has grown yearly by 1% since 2000, representing almost a quarter of global energy consumption and represents a major contribution to climate change and global warming. The research team represented by Mariana Cernicova-Buca, Vasile Gherheș, Gabriel-Mugurel Dragomir, and Roxana-Mihaela Sirbu analyzed in the article “Electrically Savvy or Not? Tentative Portrait of the Romanian Student as a Consumer of Electric Devices and Utilities” Sustainability 16, no. 3: 1239. https://doi.org/10.3390/su16031239 the profile of the Romanian student as a consumer of electricity and the influence of the place of residence (on-campus/off campus) and gender on the consumption patterns. These data highlight the actionable characteristics that can influence the young person’s choices towards an attitude of care for the resources that ensure a modern, comfortable, but energy-efficient lifestyle.
4. Water saving behaviors in the UPT student dormitories
The section contains information on:
- Water use behavior when cleaning dishes and food
- Water consumption behavior during tooth brushing
- Timeliness of repair of dripping taps
- Average shower duration in daily routine
- Preference for low temperature washing machine programs
- Loading efficiently the washing machine
- Water consumption of the shower while applying soap
- Turning on the water a few minutes before showering
- Reporting plumbing malfunctioning

Figure 4.1. Water use behavior when cleaning dishes and food

Figure 4.2. Water consumption behavior during tooth brushing

Figure 4.3. Timeliness of repair of dripping taps
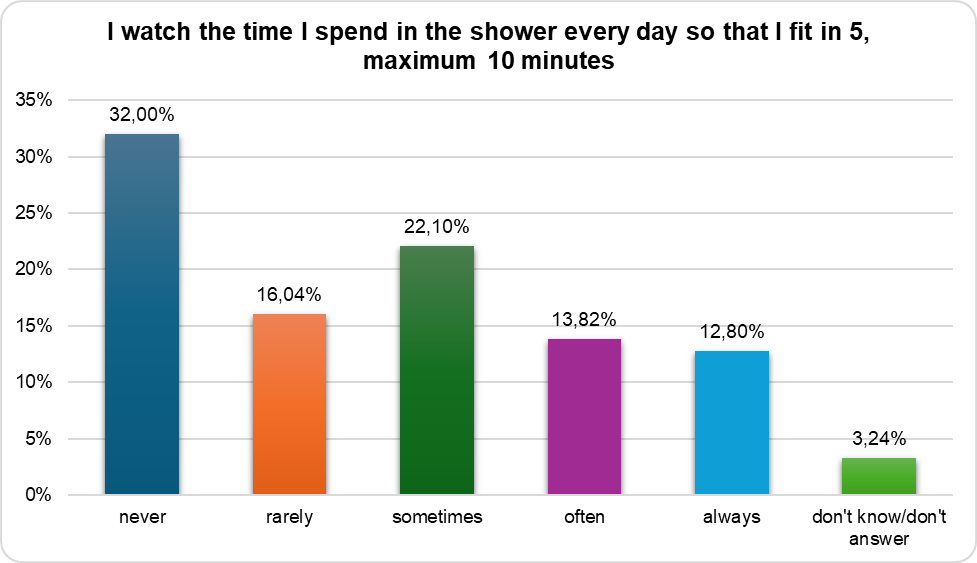
Figure 4.4. Average shower duration in daily routine
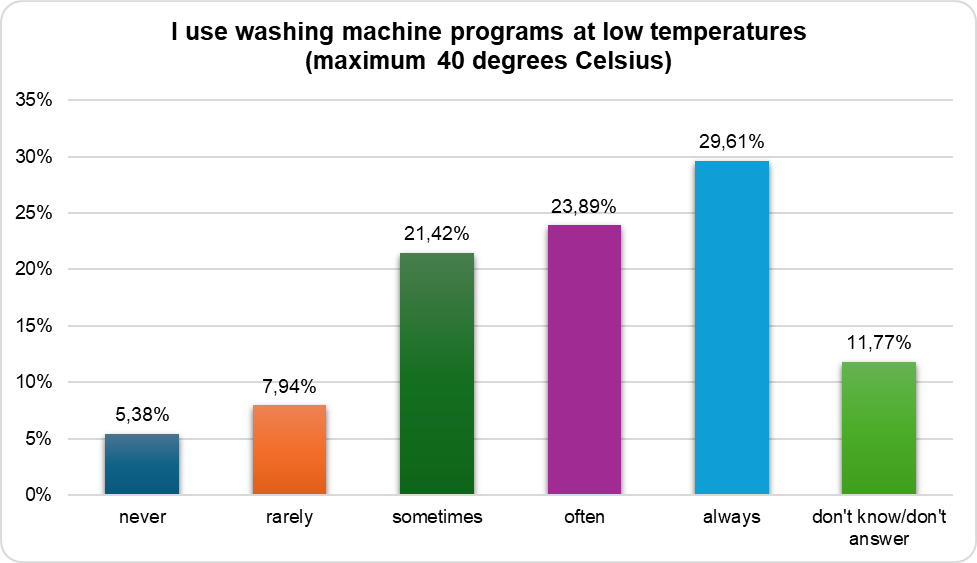
Figure 4.5. Preference for low temperature washing machine programs

Figure 4.6. Loading efficiently the washing machine

Figure 4.7. Water consumption of the shower while applying soap
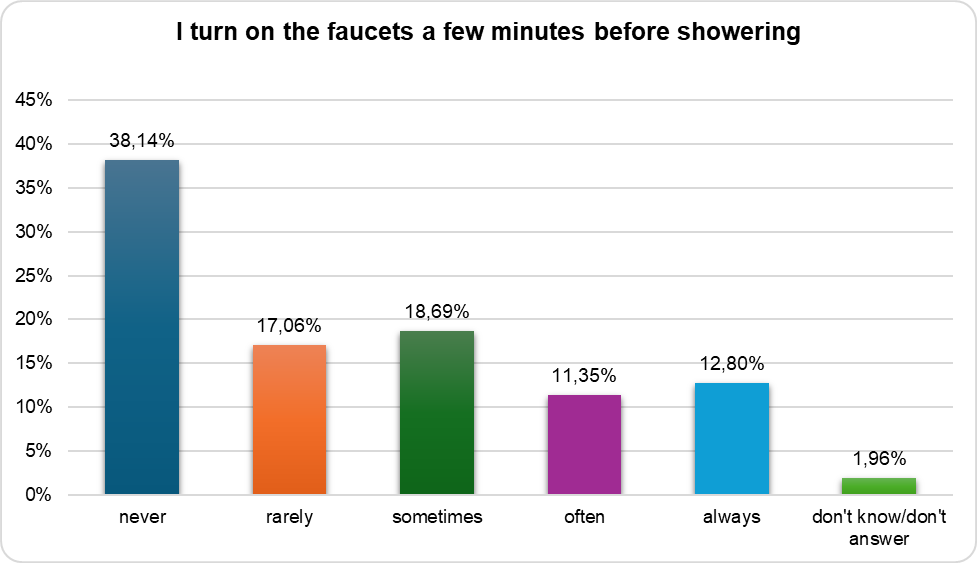
Figure 4.8. Turning on the water a few minutes before showering
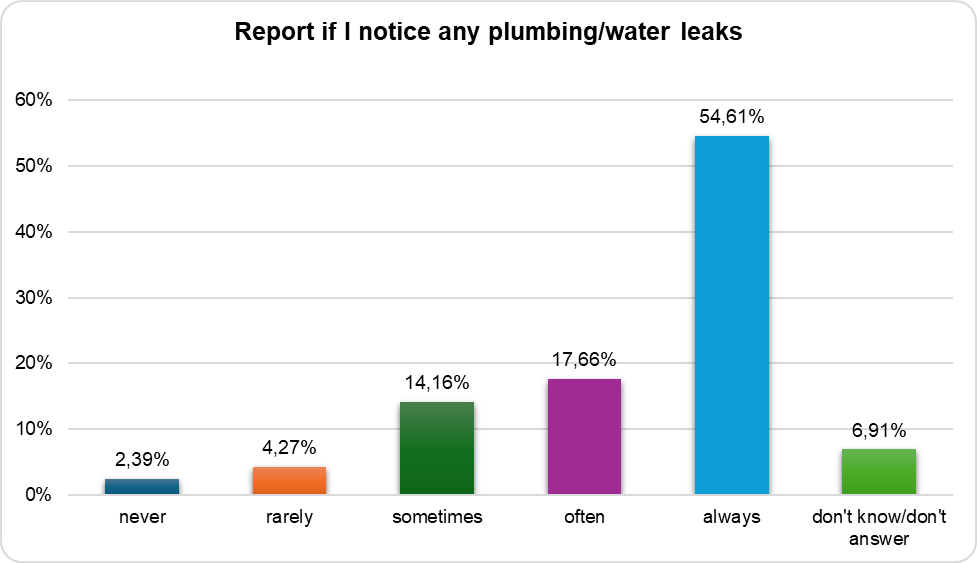
Figure 4.9 Reporting plumbing malfunctioning/water leaks
Results in brief
1. Water use behavior when cleaning dishes and food
• A significant proportion of the respondents (21.8%) confess they open the water tap to the maximum frequently (always or often), indicating a less sustainable practice in terms of conserving water resources. On the other hand, more than one third of the sample, 34.3%, resort to this practice only occasionally, suggesting that there is probably partial awareness of the importance of saving water.
2. Water consumption behavior during tooth brushing
• A significant percentage of the students in the sample (44.2%) never let water run while brushing their teeth, reflecting positive water-saving behavior. The fact that almost one-fifth of the sample allows water to flow freely during tooth brushing (10.2% often and 9.4% always) indicates an opportunity for improvement in terms of water conservation and adoption of more sustainable habits in daily activities.
3. Timeliness of repair of dripping taps
• Almost half of the respondents (46.9%) declare they always repair dripping taps, demonstrating a responsible attitude towards preventing water waste.
4. Average shower duration in daily routine
• More than a third of the students (32%) do not time the shower duration. Over a quarter of the sample (26.6% of the respondents, cumulating the answers choosing the options frequently and always) consciously manage the time spent in the shower.
5. Preference for low temperature washing machine programs
• Almost a third (29.6%) of the participants in the study always use washing programs at low temperatures, helping to save electric energy and water.
6. Loading efficiently the washing machine
• A high proportion (41.1%) of the respondents wait to be able to fully charge the washing machine before turning it on, indicating a water-efficient consumption practice.
7. Water consumption of the shower while applying soap
• A significant percentage of the sample, 42.4% (15.8% often and 26.6% always) practice this behavior frequently or constantly. This trend points to an area where there is great potential for improvement in terms of water conservation.
8. Turning on the water tap a few minutes before showering
• Almost a quarter of the respondents (24.1%) turn the shower on minutes before actually taking the shower, which may indicate either a preference for comfort (e.g., waiting for water to reach a certain temperature) or a lack of awareness of how much water is wasted by this behavior. A large proportion (38.1%) of the respondents never turn on the water tap minutes before showering, thus avoiding unnecessary waste of water.
9. Reporting plumbing malfunctions
• The majority of study participants (54.6%) always announce if they notice malfunctions in the plumbing, helping to prevent leakage and contributing to resources conservation.
5. Sustainable behaviors and practices regarding waste management in the UPT student dormitories
The section contains information on:
- Separate collection of household waste
- Use of reusable bags for shopping
- Reuse of packaging and gift boxes
- Preference for products from local producers
- Choosing eco-friendly cleaning products
- Adoption of eco-friendly means of transport
- Use of rechargeable batteries
- Borrowing books from the library
- Refusal of plastic cutlery and straws
- Using textile towels instead of paper towels
- Ecological responsibility during outdoor activities
- Preference for tap water, not bottled in plastic containers
- Use of reusable cups or glass
- Opting for online payments and reducing paper consumption
- Donation of unused clothes
- Donation of functional electronic devices
- Attention to durability when purchasing goods
- Repair of broken objects
- Choosing products with eco-friendly packaging when shopping
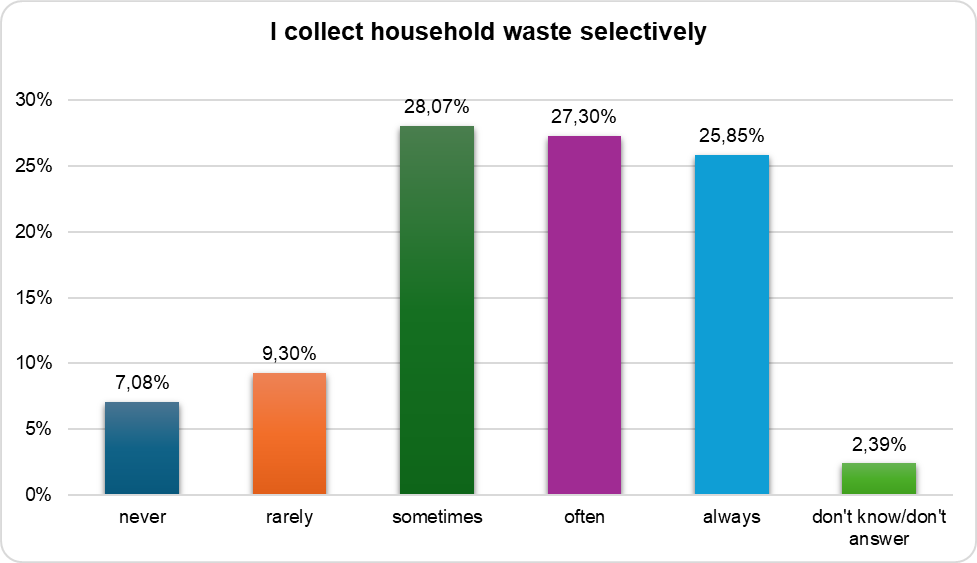
Figure 5.1. Separate collection of household waste

Figure 5.2. Use of reusable bags for shopping

Figure 5.3. Reuse of packaging and gift boxes

Figure 5.4. Preference for products from local producers
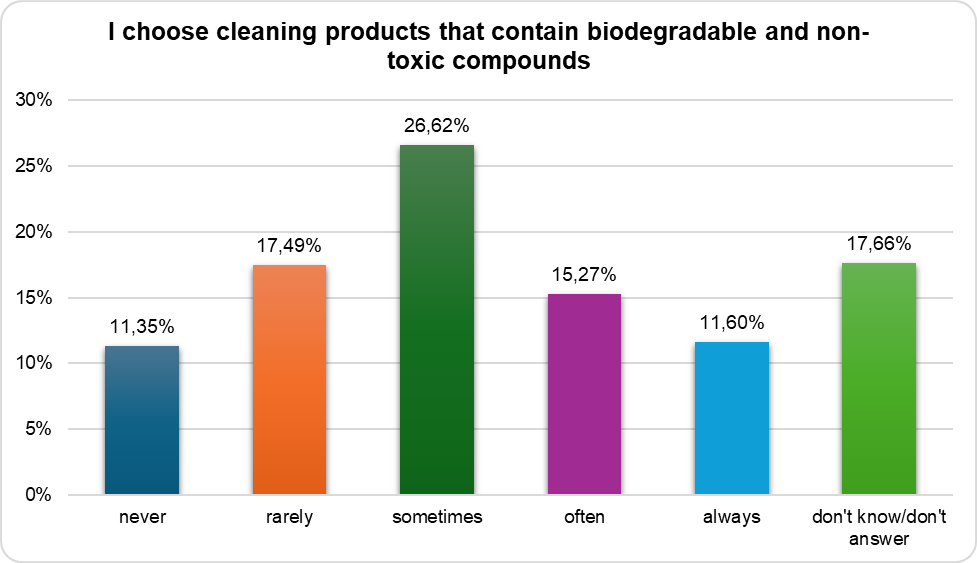
Figure 5.5. Choosing eco-friendly cleaning products

Figure 5.6. Adoption of eco-friendly means of transport
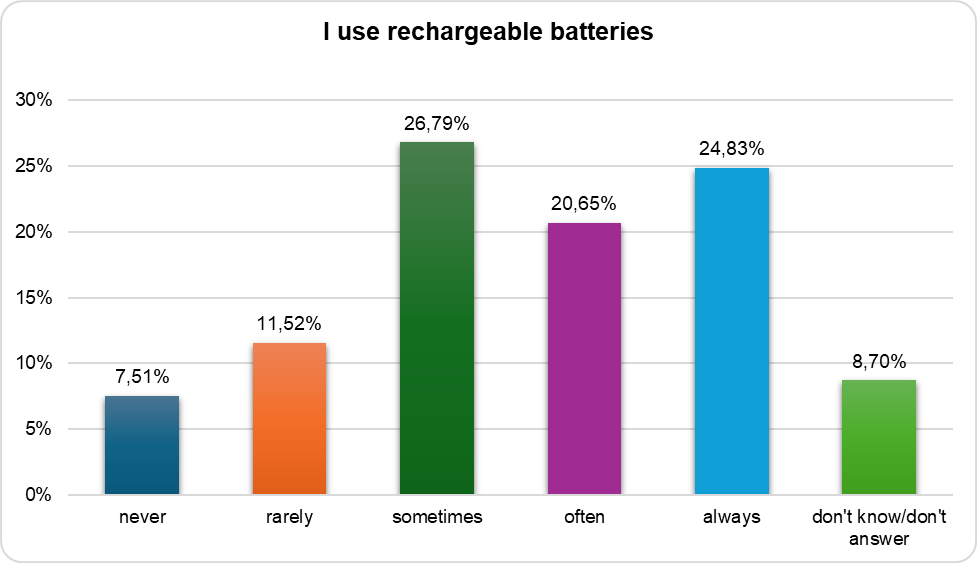
Figure 5.7. Use of rechargeable batteries
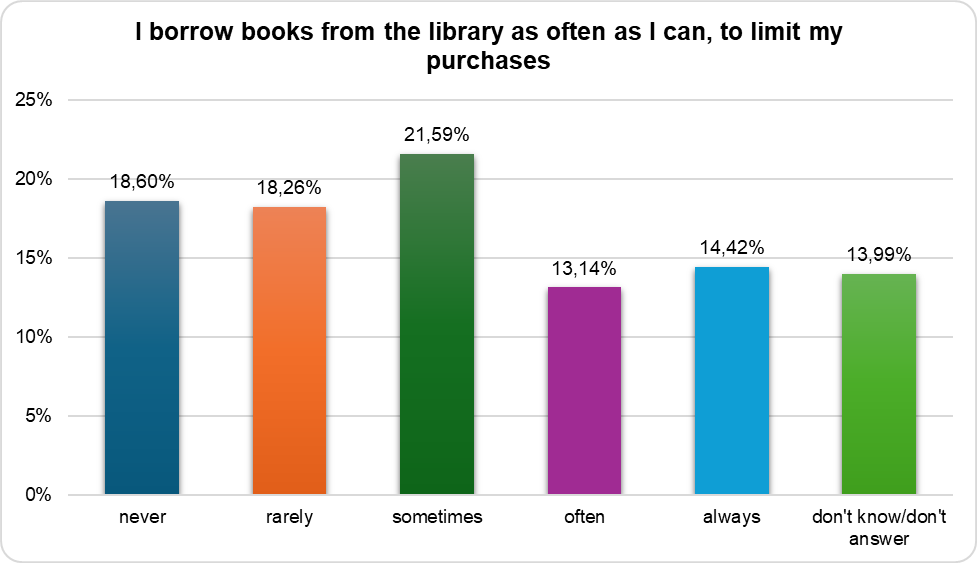
Figure 5.8. Borrowing books from the library
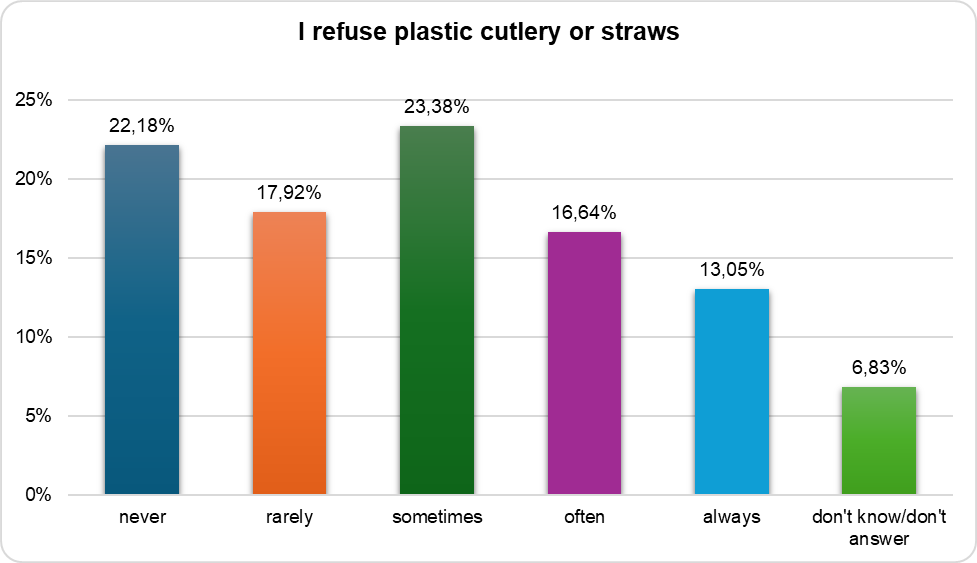
Figure 5.9. Refusal of plastic cutlery and straws
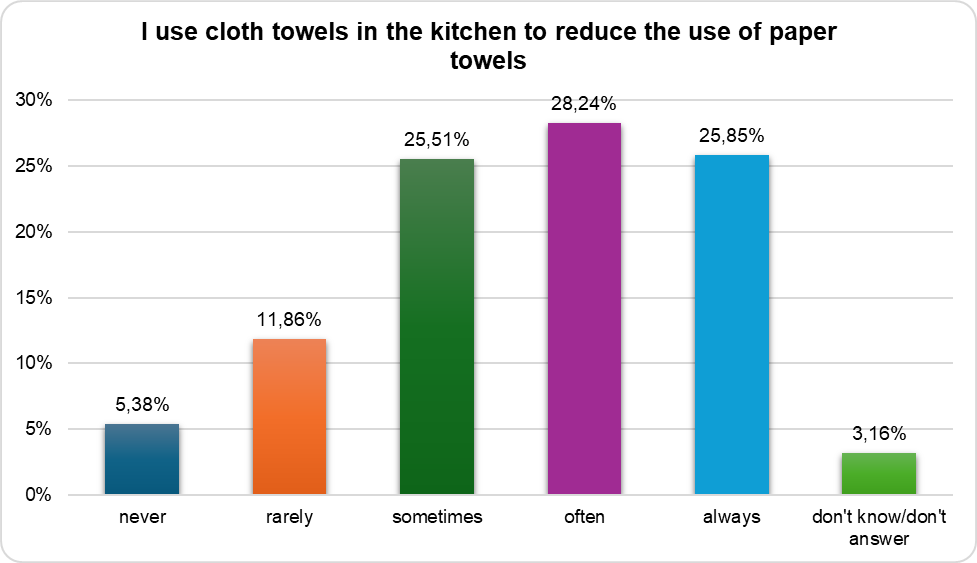
Figure 5.10. Using textile towels instead of paper towels

Figure 5.11. Ecological responsibility during outdoor activities
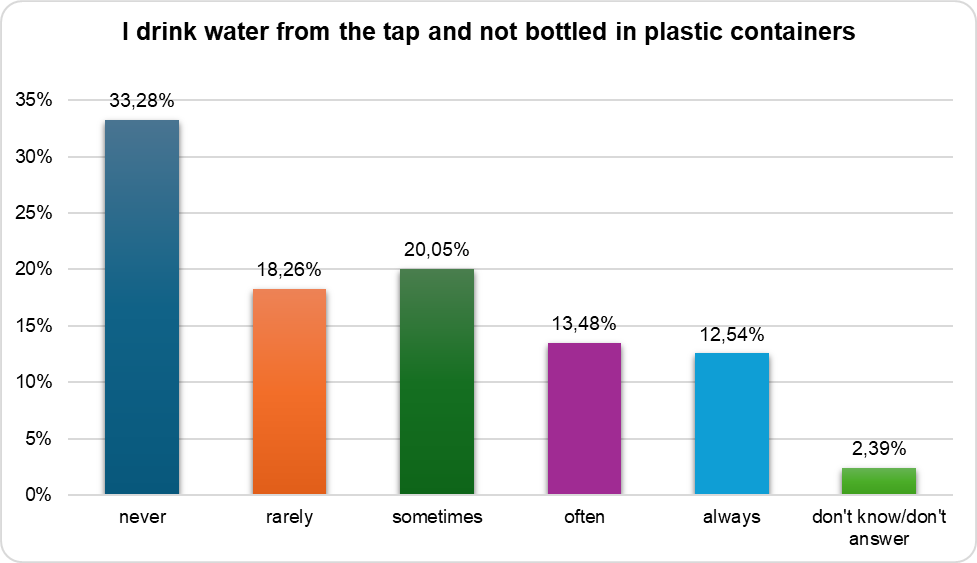
Figure 5.12. Preference for tap water, not bottled in plastic containers

Figure 5.13. Use of reusable cups or glass
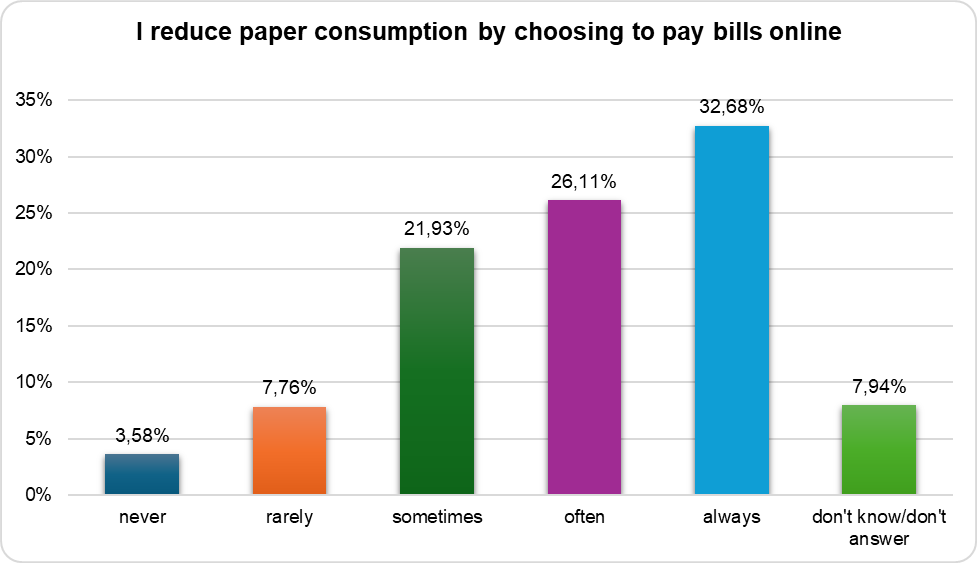
Figure 5.14. Opting for online payments and reducing paper consumption
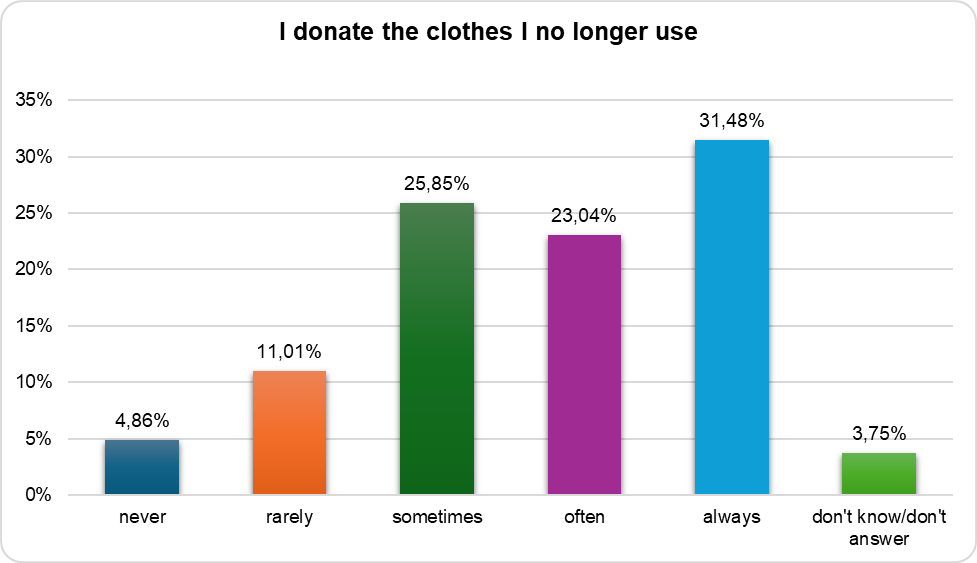
Figure 5.15. Donation of unused clothes
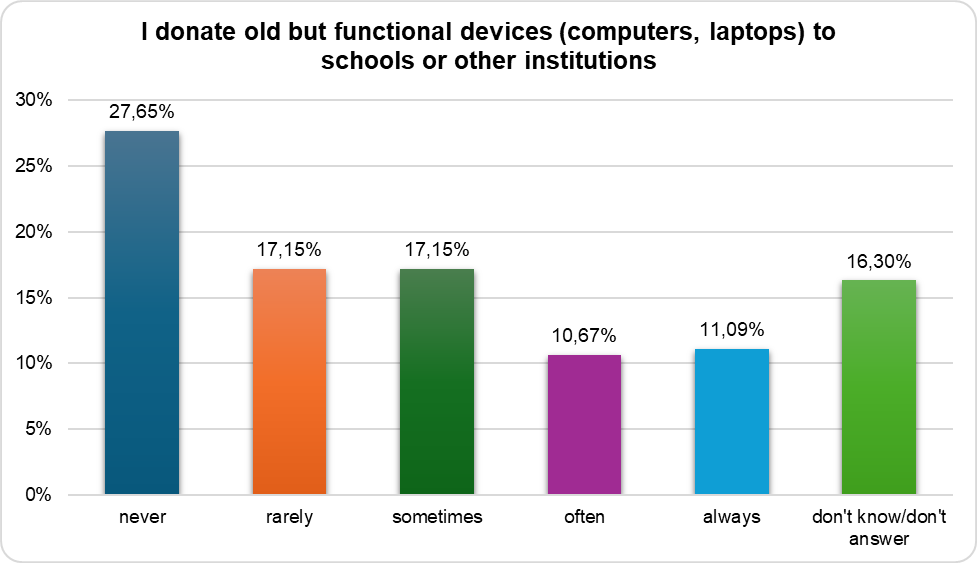
Figure 5.16. Donation of functional electronic devices

Figure 5.17. Attention to durability when purchasing goods
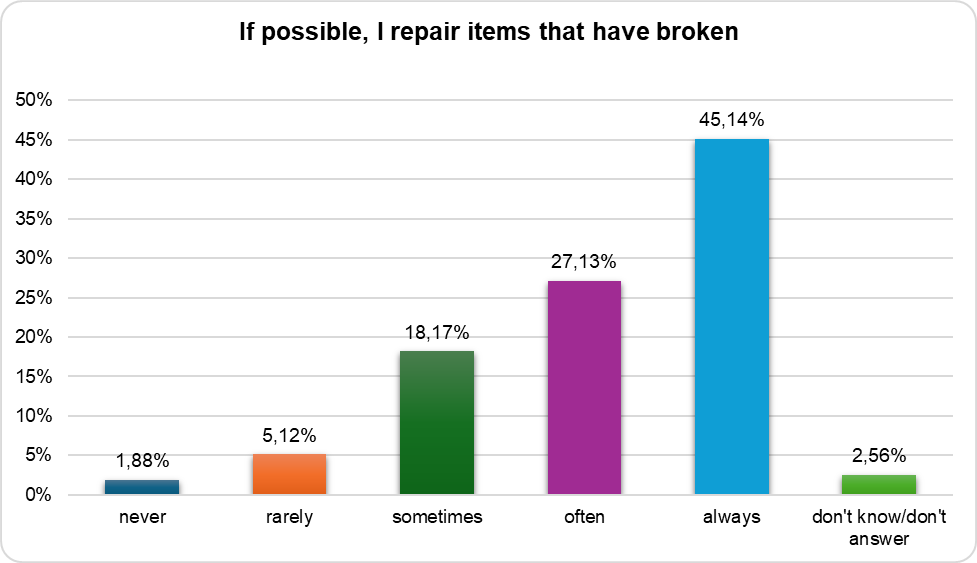
Figure 5.18. Repair of broken objects
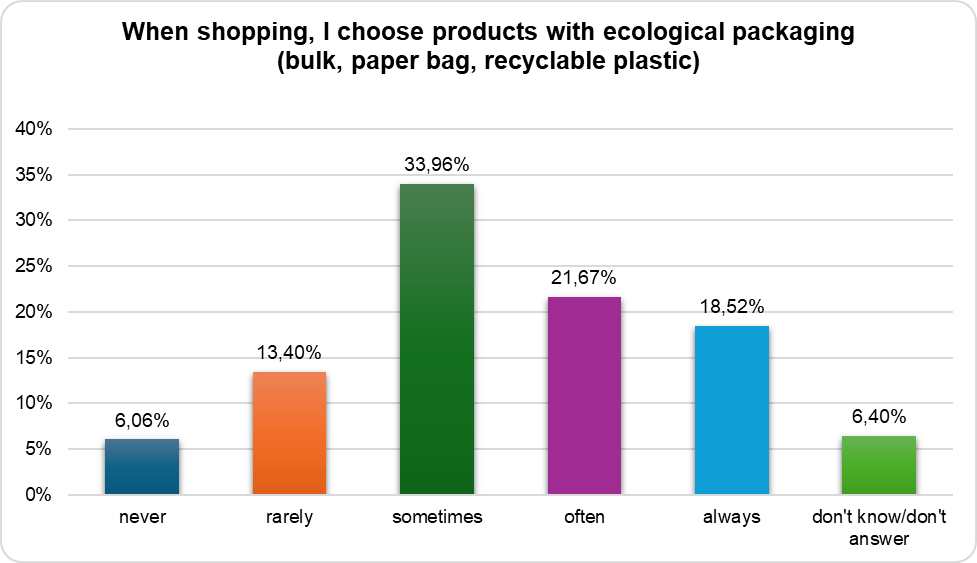
Figure 5.19. Choosing products with eco-friendly packaging when shopping
Results in brief
1. Separate collection of household waste
• Most respondents (53.2%) selectively collect household waste frequently or always, indicating an awareness of the importance of recycling. We note that there is also a proportion of 16.4% of them (7.1% never and 9.3% rarely) who do not practice this behavior or practice separate collection only occasionally.
2. Use of reusable bags when shopping
• About half of the participants in the study (52.8%) often or always use cloth/paper/bio-degradable nets when shopping, demonstrating a commitment to reducing plastic waste. On the other hand, 17.5% of them (4.4% never and 13.1% rarely) avoid or only occasionally use these sustainable alternatives.
3. Reuse of gift packaging and boxes
• A significant majority of the respondents (74.6%) reuse gift bags and boxes, reflecting a common practice of waste reduction.
4. Preference for products from local producers
• Less than half of respondents (39.2%) frequently or always choose to buy from local producers, suggesting an opportunity to improve local support and reduce CO2 emissions. On the other hand, less than 17.7% of the respondents (4.0% never and 13.7% rarely) do not prioritize or only occasionally choose to buy from local producers.
5. Choosing eco-friendly cleaning products
• A quarter of the sample (26.9%) declare to use eco-friendly cleaning products, indicating an area where awareness can be raised, and behavior can be improved often or always. A proportion of 11.3% of respondents indicate that they never choose such products, while 17.5% of them rarely do so.
6. Adoption of eco-friendly means of transport
• The majority of the surveyed students (60.5%) frequently or always use public transport, walking or cycling, showing a positive trend towards sustainable mobility.
7. Use of rechargeable batteries
• Almost half of the respondents (45.4%) often or always use rechargeable batteries, demonstrating a preference for sustainable solutions. A cumulative proportion of 19% of the respondents (out of which 7.5% selected the option never and 11.5% the option rarely) do not or only occasionally use rechargeable batteries.
8. Borrowing books from the library
• A relatively small proportion (27.5%) borrow books from the library frequently or always. 18.6% of respondents indicate that they never borrow books from the library, while 18.3% of them rarely do so. In other words, more than a third (36.9%) of the sample seems to prefer buying new books over borrowing them.
9. Refusal of plastic cutlery or straws
• An important share of the sample (29.7%) often or always refuses plastic cutlery or straws. A proportion of 22.2% of participants indicate that they never refuse plastic cutlery or straws. 17.9% choose to refuse these plastic products rarely, which may indicate a lack of awareness of the problem, but also the existence of barriers to adopting more sustainable behavior consistently.
10. Use of textile towels instead of paper towels
• More than half of the respondents (54.1%) often or always use textile towels, thus reducing paper waste.
11. Environmental responsibility during outdoor activities
• A large majority of subjects (80.3%) do not leave waste behind them when spending time outdoors, showing a deep respect for the environment.
12. Preference for tap water, not bottled in plastic containers
• A significant proportion of 33.3% of respondents indicate that they never drink tap water, preferring bottled water, and 18.3% of them choose to drink tap water rarely. We notice that a proportion of 26% of respondents (13.5% often and 12.5% always) choose to drink tap water frequently or exclusively.
13. Use of reusable cups or glass:
• The majority of the students in the sample (79.2%) often or always use reusable cups or glass, thus avoiding disposable waste.
14. Online payments to reduce paper consumption
• A substantial proportion of respondents (58.8%) choose online payments to reduce paper consumption, demonstrating a commitment to waste reduction.
15. Donation of unused clothes
• The majority of the respondents (54.5%) donate clothes they no longer use, contributing to the circular economy and reducing waste. A small proportion of 4.9% of them indicate that they never donate clothes they no longer use, and 11.0% rarely do so.
16. Donation of functional electronic devices
• Only a minority of those surveyed (21.8%) frequently or always donate old devices, suggesting an area where donation behavior can be improved. 44.8% of respondents (27.6% never and 17.2% rarely) do not practice or practice only occasionally this form of responsible recycling and community support.
17. Attention to sustainability when purchasing goods
• A large proportion of respondents (69.6%) pay attention to the durability of products when making purchases, showing an awareness of the importance of sustainability.
18. Repair of broken objects
• The respondents indicated a strong commitment to sustainable practices, highlighting a clear preference for repairing and extending the life of objects instead of replacing them. This interpretation is prompted by the percentages: 27.1% of the students declare they often repair broken/malfunctioning items, and a majority of 45.1% always do so.
19. Choosing products with ecological packaging
• A significant proportion of the sample (40.2%) frequently or always choose products with ecological packaging, helping to reduce waste. A proportion of 19.5% of respondents (6.1% never and 13.4% rarely) do not prioritize or only occasionally choose environmentally friendly packaging.
6. Recycling behaviors and practices in the UPT student dormitories
The section contains information on:
- Extent of selective collection of household waste
- Selective collection practices in personal space
- Sorting waste according to bin color
- Recycling behavior at school
- Selective collection of waste in various premises
- Glass recycling
- Recycling plastic containers
- Battery recycling
- Light bulb recycling
- Recycling of iron packaging waste
- Aluminum recycling
- Collection and recycling of used food oil
- Recycling of electronics and home appliances
- Recycling printer toner

Figure 6.1. Extent of separate collection of household waste

Figure 6.2. Separate waste collection practices in living areas
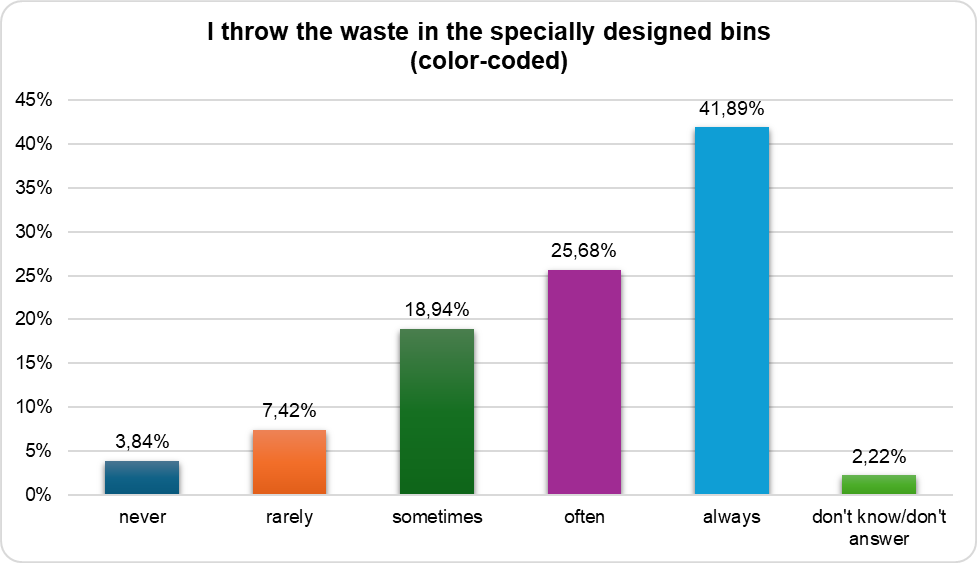
Figure 6.3. Sorting waste according to bin color
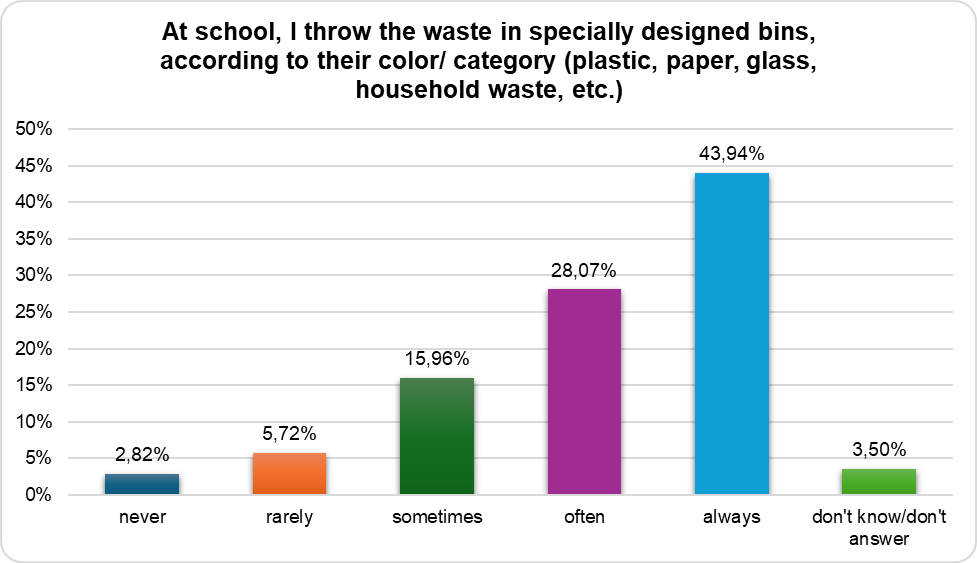
Figure 6.4. Recycling behavior at school
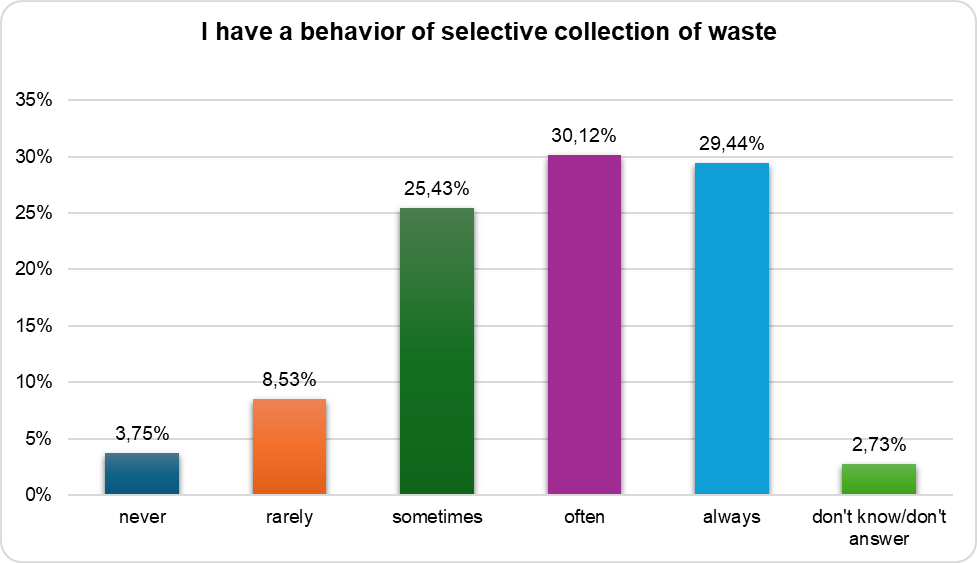
Figure 6.5. Separate collection of waste in various premises
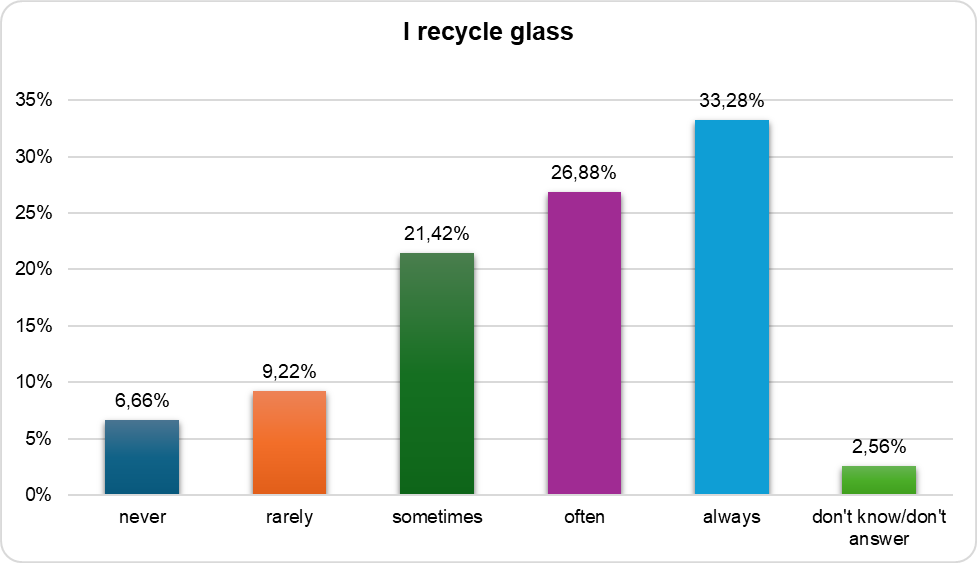
Figure 6.6. Glass recycling

Figure 6.7. Plastic containers recycling
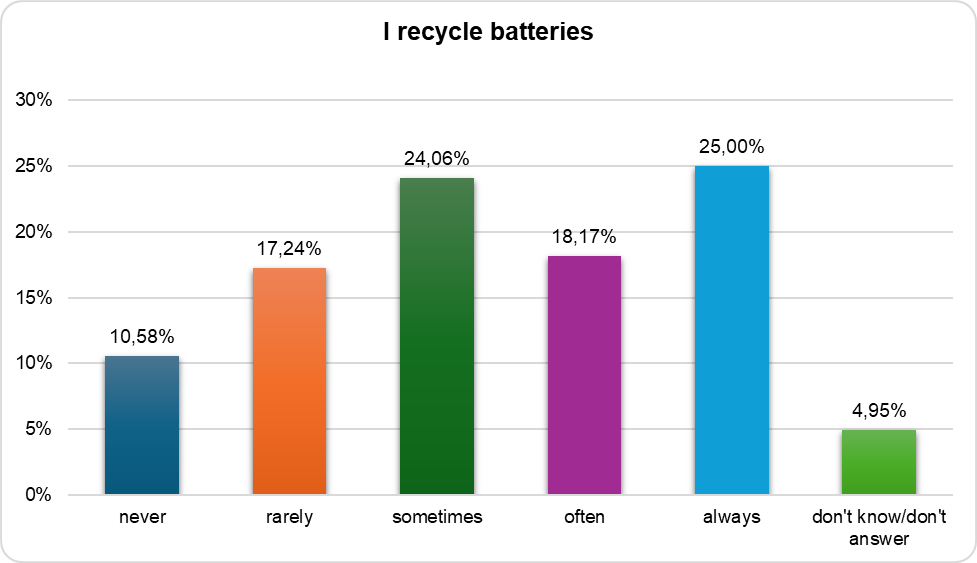
Figure 6.8. Battery recycling

Figure 6.9. Light bulbs recycling
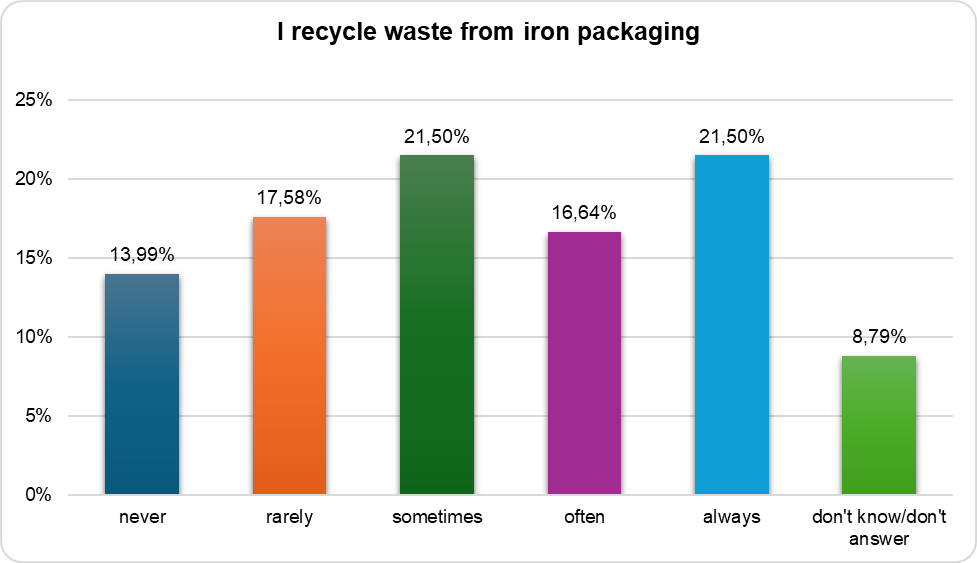
Figure 6.10. Iron waste recycling

Figure 6.11. Aluminum recycling

Figure 6.12. Cooking oil recycling
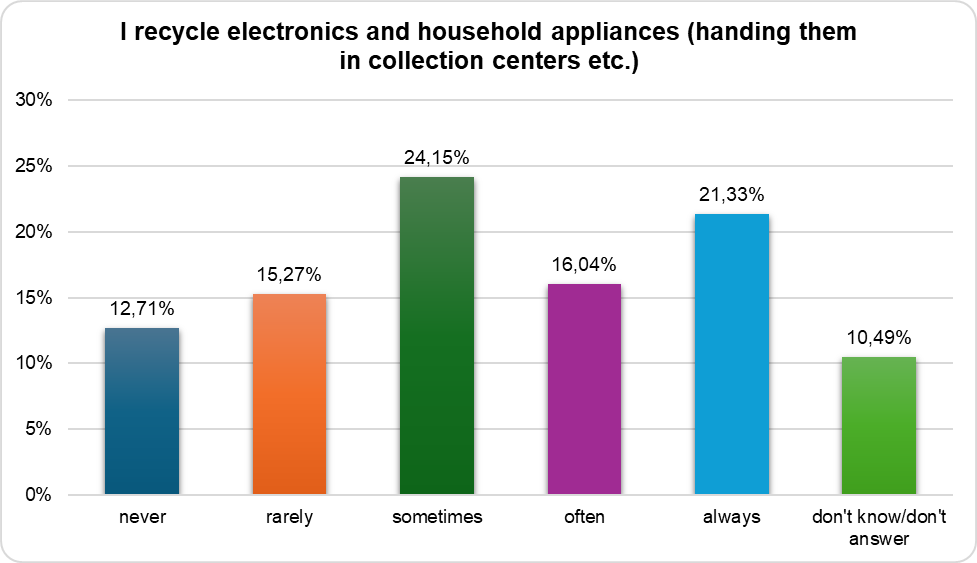
Figure 6.13. Electronics and household appliances recycling

Figure 6.14. Printer toner recycling
Results in brief
1. Separate collection of household waste
• Most respondents (56.6%) selectively collect household waste to a large or very large extent, indicating a relatively good awareness of the importance of recycling.
2. Separate collection behavior in different premises
• A significant proportion of the students practice separate waste collection both at home (52.4%) and at school or work (71.9%), demonstrating an expansion of sustainable behavior in different settings.
3. Solutions for more efficient separate collection
• Respondents suggest that better collection organization (0.6%), information campaigns (9.2%) and more separate collection points (13.2%) could improve the efficiency of separate collection.
4. Recycling of various materials
• Glass and plastic containers are the most frequently recycled materials, with 60.2% and 65.4% of respondents recycling them often or always, respectively.
• The recycling of batteries, light bulbs, iron, and aluminum packaging, as well as used cooking oil is tackled in a variety of ways, with a higher proportion of participants declaring that they never or rarely practice recycling these materials.
• Electronics and home appliances are recycled by 37.3% of respondents often or always, indicating an awareness of the importance of recycling electrical and electronic equipment.
• Recycling printer toner is less common, with 22.6% of study participants practicing it often or always. A significant proportion of them (29.3%) do not know or do not answer this question.
7. Sustainability practices in the housing and learning environment in the UPT student dormitories
The section contains information on:
- Power saving practices: turning off the computer
- E-mail printing
- Eco-printing preferences: double-sided and black and white
- Optimizing paper use: two-sided copying
- Paper recycling
- Car sharing
- Printing educational resources
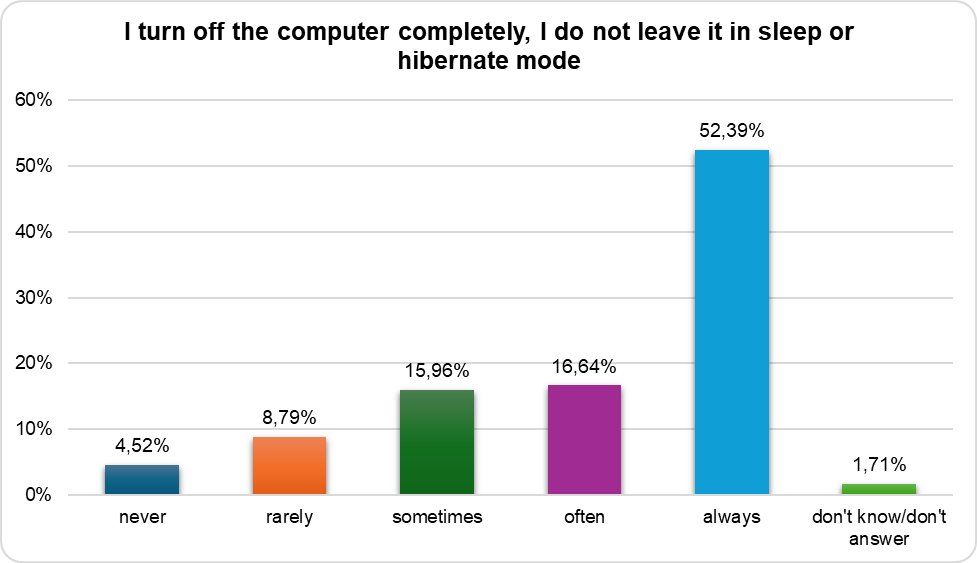
Figure 7.1. Power saving practices: turning off the computer
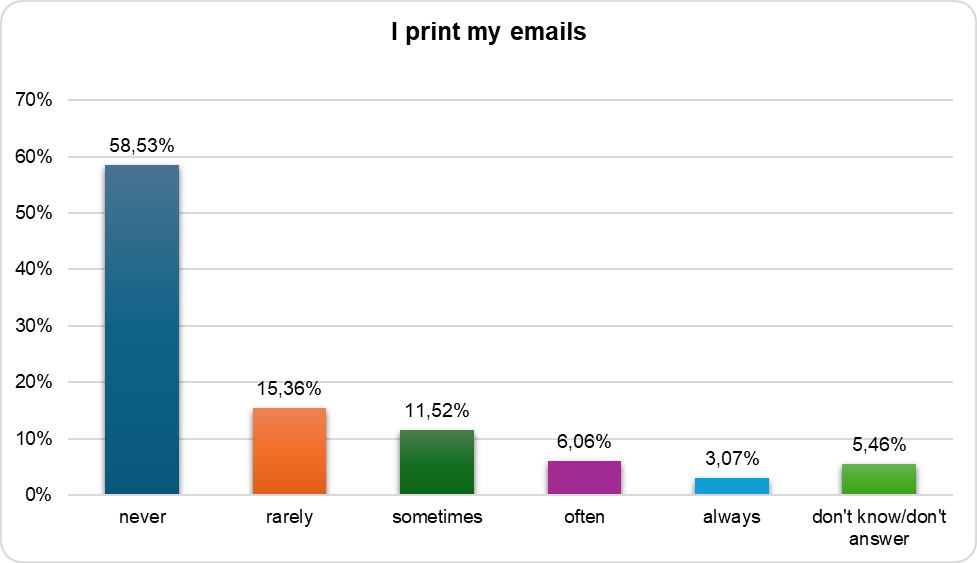
Figure 7.2. E-mail printing
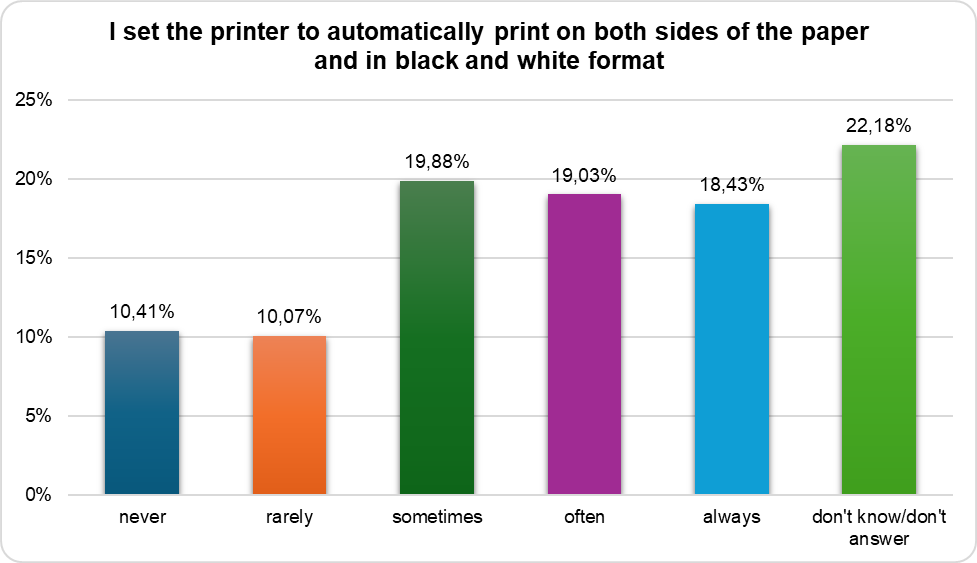
Figure 7.3. Eco-printing preferences: double-sided and black and white
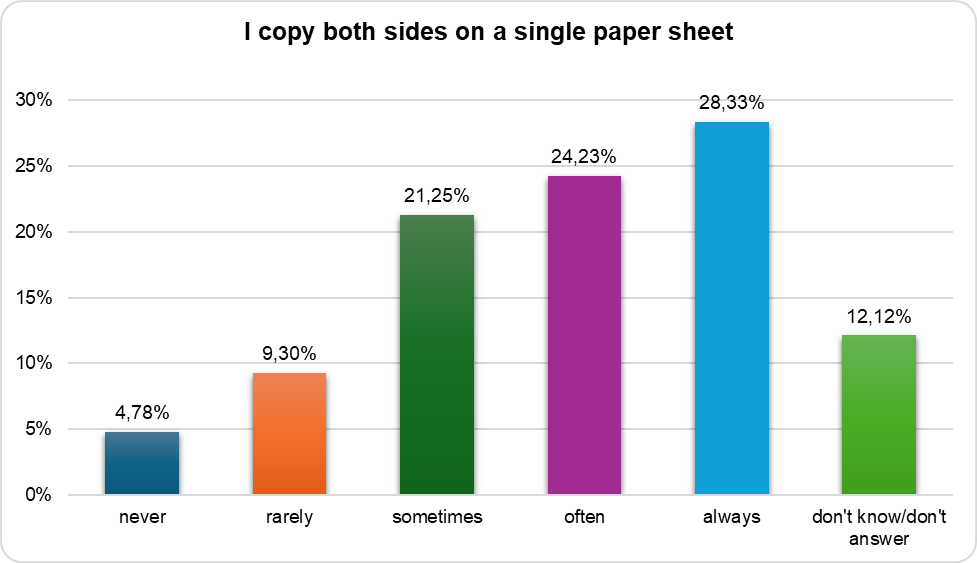
Figure 7.4. Optimizing paper use: two-sided copying
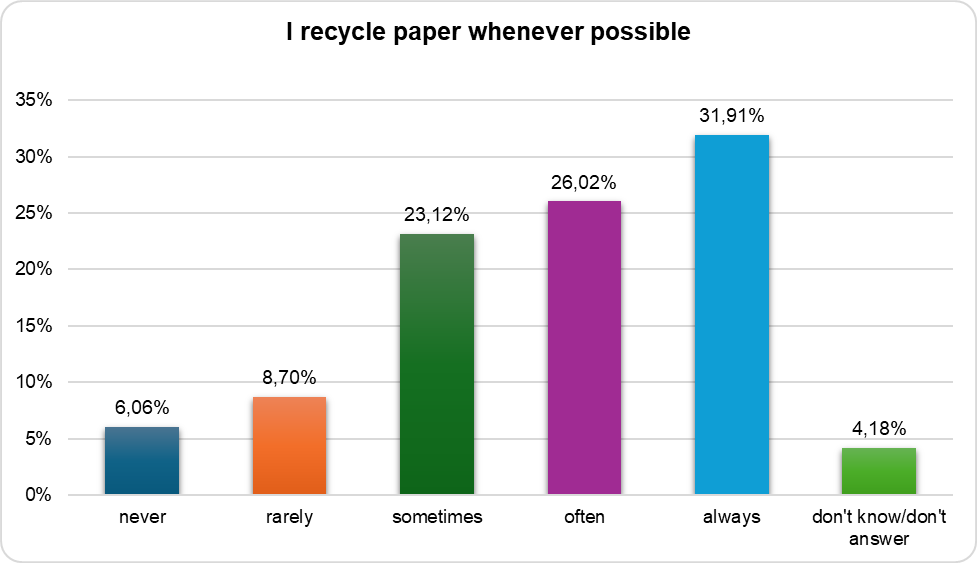
Figure 7.5. Paper recycling
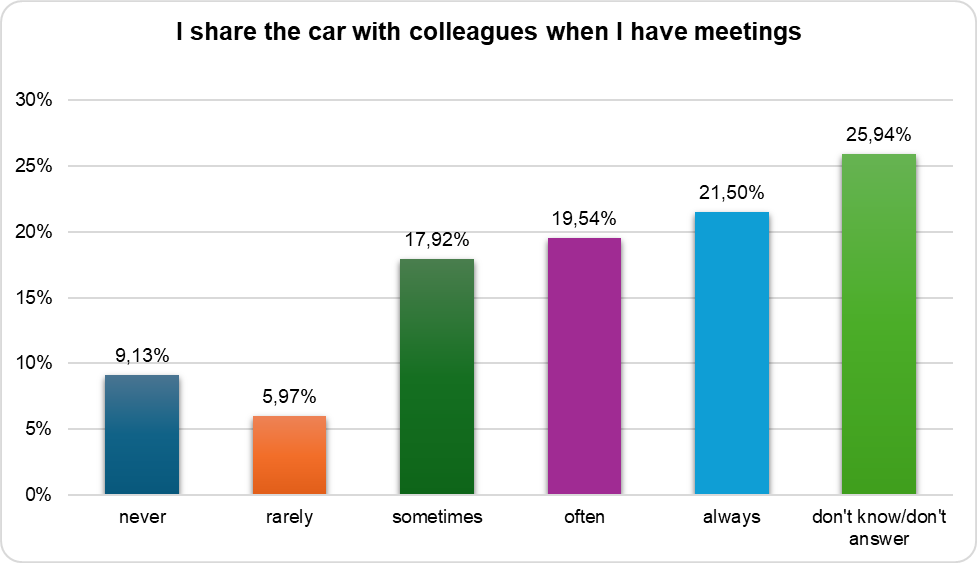
Figure 7.6. Car sharing

Figure 7.7. Printing educational resources
Results in brief
1. Power saving practices: turning off the computer
• Most respondents (52.4%) turn off their computer completely at the end of the day, demonstrating good power saving practice.
2. E-mail printing
• A large proportion of the students in the sample (58.5%) never print emails, indicating a preference for maintaining digital communications and reducing paper consumption.
3. Eco-printing preferences: double-sided and black and white
• Behaviors are varied, but 37.4% of respondents set the printer to print automatically in this way, helping to reduce paper and toner consumption.
4. Copying double-sided to a single paper sheet
• A significant proportion of the surveyed students (52.5%) often or always copy double-sided, showing an awareness of the importance of reducing paper waste.
5. Paper recycling
• The majority of respondents (57.9%) recycle paper often or always, highlighting a well-rooted sustainable practice.
6. Car sharing
• A considerable proportion of the respondents (41%) share their car with colleagues often or always, promoting a reduction in carbon emissions and traffic.
7. Printing educational resources
• Behaviors are varied, but a higher proportion of respondents (45.8%) print educational resources rarely or never, suggesting a trend towards the use of digital resources.
8. Commitment to environmental protection and energy saving in the UPT student dormitories
The section contains information on:
- Participation in voluntary cleaning actions
- Signing petitions for environmental protection
- Involvement in tree planting actions
- Donations to environmental organizations
- Personal motivation for saving energy
- The influence of smart technologies on energy saving
- Impact of individual consumption-related payment
- The influence of others on energy-saving behaviors
- The role of information in optimizing energy consumption

Figure 8.1. Participation in voluntary cleaning actions
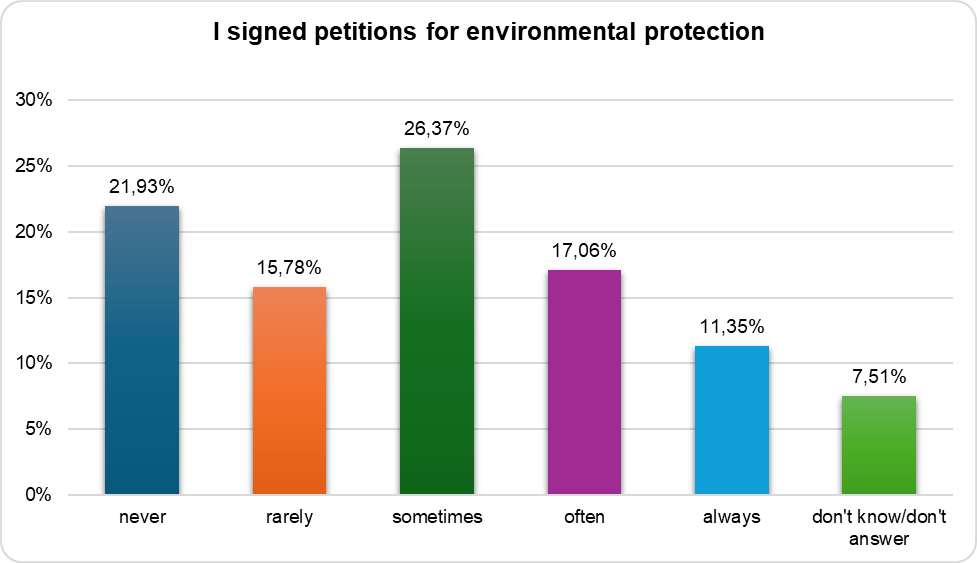
Figure 8.2. Signing petitions for environmental protection

Figure 8.3. Involvement in tree planting actions
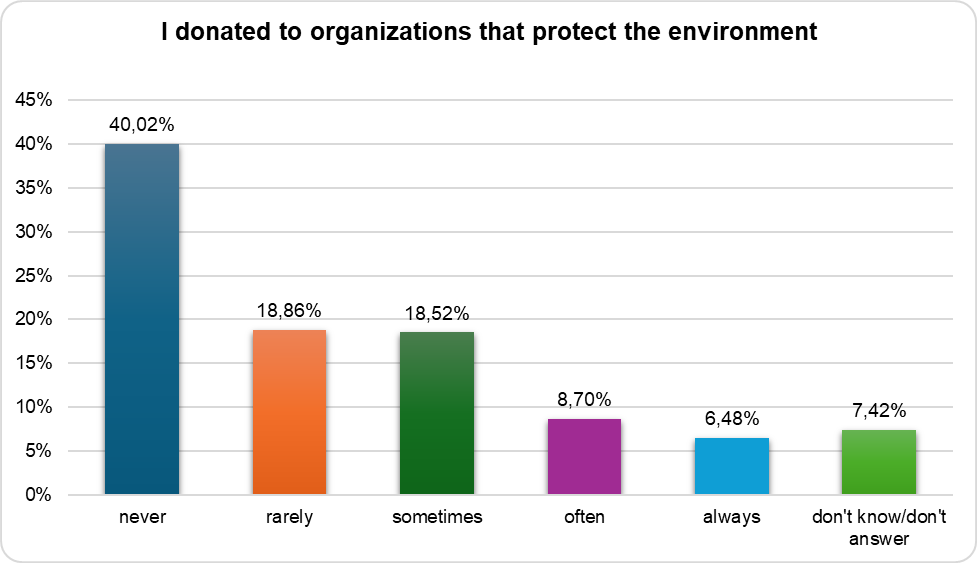
Figure 8.4. Donations to environmental organizations

Figure 8.5. Personal motivation for saving energy

Figure 8.6. The influence of smart technologies on energy saving
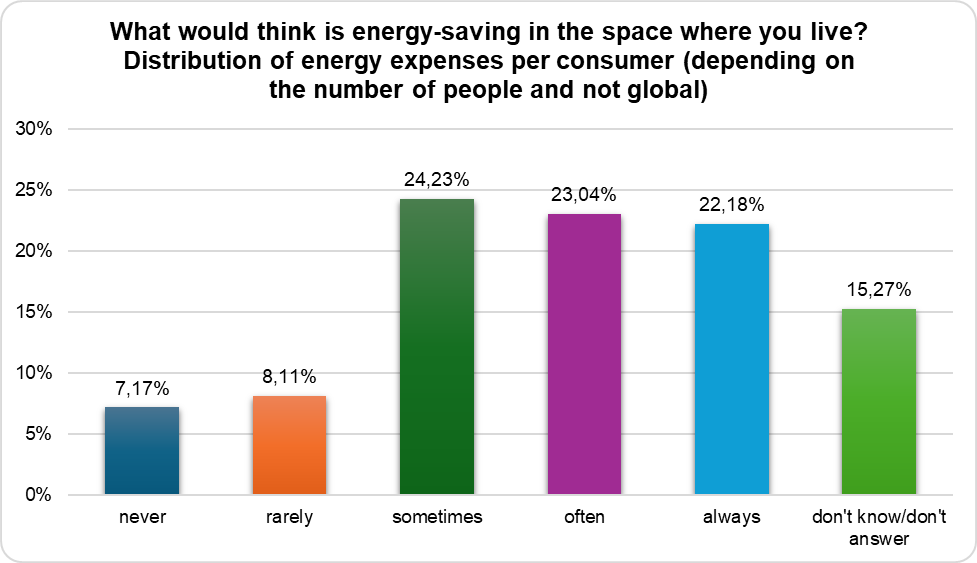
Figure 8.7. Impact of individual consumption-related payment
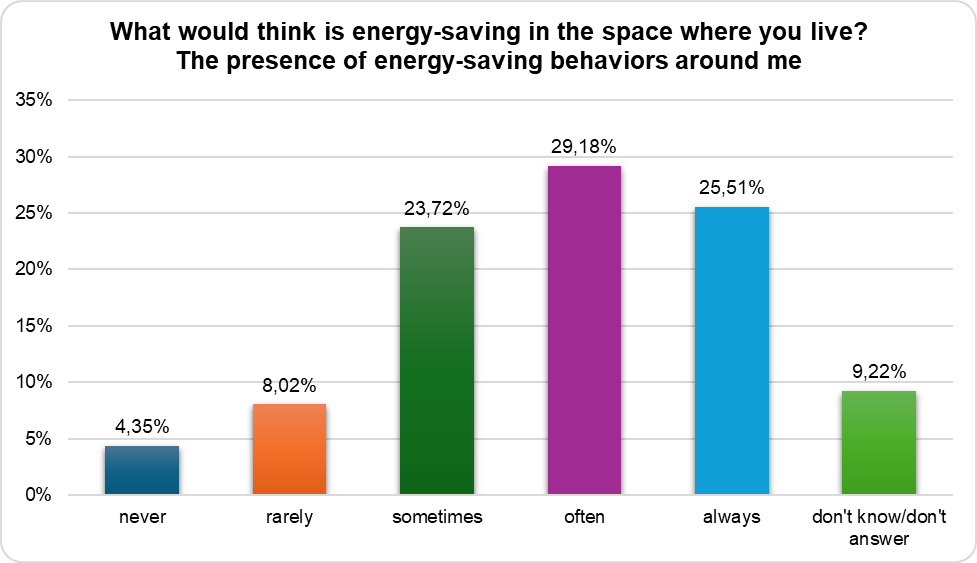
Figure 8.8. The influence of others on energy-saving behaviors
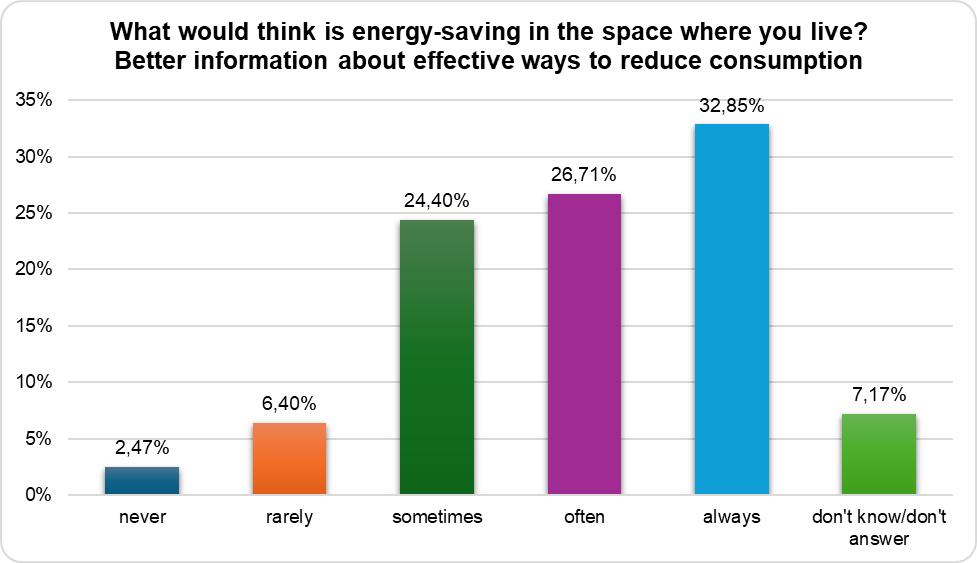
Figure 8.9. The role of information in optimizing energy consumption
Results in brief
Involvement in environmental protection
• Cleaning actions: A significant proportion of respondents (49.7%) have participated at least occasionally in cleaning actions, 9.7% of them always getting involved in these actions.
• Signing petitions: More than half of the respondents (54.8%) have signed petitions for environmental protection at least occasionally.
• Tree planting: About 37.2% of participants have at least occasionally been involved in tree planting actions.
• Donations to environmental organizations: The majority of respondents (40.0%) have never made donations to organizations that protect the environment, indicating an area where engagement can be improved.
Factors influencing energy saving
• Self-awareness: It is the main factor that causes study participants to save energy, with 39.3% of them stating that they always try to reduce energy consumption.
• Smart technologies: Around 52.2% of participants would be motivated to save energy by using smart technologies at least frequently.
• Individual consumption-related payment: Around 45.2% of the respondents would be more motivated to save energy if costs were shared per consumer.
• The influence of others on energy-saving behaviors: The presence of other energy-saving people motivates 54.7% of respondents to do the same.
• Information about reducing consumption: Better information would lead 59.5% of study participants to adopt energy-saving measures.
4.2. Technical measurements — basis for strategic decisions
Universities, as institutions at the forefront of promoting sustainability, should also provide models for calculating, monitoring, reporting, reducing or even offsetting their impact on the environment, or in other words, their carbon footprint. Some of the rankings attesting to the sustainability of universities explicitly require that institutions entering the evaluation also publish reports on their carbon footprint (STARS 2024). However, as Helmers et al. note, there is no specific standardized methodology for inventorying the sources responsible for producing carbon emissions and for objectively calculating the carbon footprint of universities (Helmers et al., 2021). The task of calculating the carbon footprint is all the more difficult, as a complex set of elements that depend on the university must be taken into account, such as investments in buildings, resource management, the balance between built heritage and green spaces, the types of activities that take place on campus, but also elements related to the geographical area and climate of the region where the university is located. The type and size of the institution are also relevant in calculating the carbon footprint. Santovito and Abiko provided recommendations on how to prepare the inventory of emission sources leading to the carbon footprint, identified relevant sources of emissions, and allowed better visualization of mitigation opportunities (Santovito and Abiko, 2018). Universities can reach zero carbon emissions, as proven by Leuphana University in Germany, which achieves this goal through maximum use of modern technology and overproduction of renewable energy on-site (Helmers et al., 2021), but, researchers warn, this effort moves the carbon footprint issue upstream, because of the materials incorporated into applied technologies. This can lead to long payback periods and unquantified effects for universities. Helmers et al. appreciate that almost every university in the world, regardless of its climate, focus and profile, can reach very low carbon footprints, based on political will, necessary investments and creativity (Helmers et al., 2021). But the target can only be achieved if it is pursued systematically, coherently, and strategically.
Most universities either assess the energy performance of built space, or infer their carbon footprint based on mathematical models, taking into account students’ consumption habits or, more broadly, the type of sources that impact the environment (Rodrigues-Andara et al., 2020; Valls-Val and Bovea, 2021; Sippel et al., 2018; Xiwang Li et al., 2015; Ozawa-Meida et al., 2013).
The USE-REC project aimed to implement innovative strategies for collecting and analyzing data on students’ energy consumption in the university campus environment, but also to establish reference points to substantiate efforts to reduce the carbon footprint of the campus as a whole. The collected data and the established correlations can serve as a foundation for the development of educational initiatives and practical actions to reduce the environmental footprint of the university community of the Politehnica University of Timisoara.
Timisoara is located in the western part of Romania, close to the borders with Serbia and Hungary. It has a temperate-continental climate with cold winters and hot summers. Over the past two decades, extreme records have reached -24 °C in January 2003 for cold and +41 °C, set in July 2007 for heat. Such a variation in outdoor temperature puts pressure on energy consumption, since in winter it is necessary to heat the spaces, and in summer – to cool them, to ensure the necessary thermal comfort. Under these circumstances, consumption control strategies must take into account the environmental factor, not only the technical characteristics of the buildings or the behavior of the occupants of the respective buildings.
Along with the point of view of the institution’s management representatives, dormitory administrators and students, aspects collected through individual and group interviews, results described in the specific chapters, we completed the starting point database of the project with a monitoring of student consumption in three areas: water consumption, electricity consumption and thermal energy consumption. The data were provided by the relevant technical service of UPT during the project months, compared to the consumption data of the previous year, to allow the evaluation of changes in the behaviors of residents in the dormitory (if they occurred). This monitoring of consumption and comparisons with the year prior to unfolding the project allowed the project team to create a profile of the student as a consumer of utilities. Also, these activities helped establish a ranking of dormitories according to the saving of resources reflected in consumption, as a result of the information and persuasion campaigns.
The communication of these data made students more aware of their personal carbon footprint (Sippel et al., 2018) and understand the consequences of everyday habits, which can be steered towards a more judicious use of resources.
The data from the monitoring of consumption was completed by an assessment of energy losses in the UPT student complex, by thermal scanning of residential buildings. Literature appreciates this method as non-destructive and non-invasive, capable of detecting potential problems in built structures, machinery, or infrastructure. In the case of the Politehnica campus, the use of thermal scanning provided data on irregular heat distribution, identified potential insulation defects and loss points, allowing the elaboration of an intervention plan based on a thorough documentation of the situation in the field, adapted to the specific features of the buildings concerned (Fishermen et al., 2016). The main disadvantage that makes this method rarely employed in the process of assessing the sustainability of universities is the relatively high cost of the procedure, correlated with the necessary logistics (approvals related to the use of airspace, temperature conditions, vegetation, presence of ample glazed surfaces). For the scanning performed within the project, the team in charge of the process undertook the steps described below.
Selection of dormitories for thermal scanning and field data collection
The purpose of the project was also to identify energy losses, propose solutions for energy efficiency and to reduce the carbon footprint of student dormitories in the Student Complex in Timisoara.
The methodology for selecting the dormitories for thermal scanning involved a careful and rigorous approach, considering the use of both terrestrial and aerial measurements. The main aspects taken into consideration were the analysis of airspace flight restrictions and the identification of an optimal area for scanning, in line with the objectives of the project. Also, the diversified choice of dormitories allowed the team to obtain representative data for different types of construction and uses, thus supporting the objectives of energy consumption analysis.
The technical team performed thermal scanning operations with both the terrestrial scanner and the drone equipped with a thermal camera, depending on the technical specifications of the equipment. The process also included precise measurements using the Leica TS1205 Total Station and the South G1 Plus GNSS receiver to ensure precise geographic control and reference of collected data. This approach ensured efficient data collection in line with the objectives of the project, in compliance with safety rules and regulations in force in the field of air drone operations.
Aerial measurements and data processing
In the first stage of the project, a flyover of the Timisoara Student Complex was conducted, using the drone’s RGB camera. This overview provided a detailed picture of the entire complex, allowing the team to identify the general characteristics of the infrastructure and obtain a global perspective on the area of interest. The photos captured with the RGB camera provided clear and detailed visual information about buildings, green spaces, and other elements of the complex, thus preparing the ground for a comprehensive assessment of energy efficiency. Once the team completed the overall analysis, attention moved to the detailed flyover of the target dormitories, using the drone equipped with the Flir Vue Pro 640R thermal camera. This phase allowed the exploration of specific thermal aspects of buildings, highlighting temperature variations and identifying potential heat loss or thermal anomalies. The high-resolution thermal camera provided accurate and reliable data, helping to assess energy efficiency and identify possible areas for improvement in thermal insulation or heating systems. The combination of RGB and thermal visual data provided a holistic perspective, consolidating the information needed to develop effective strategies for assessing the energy efficiency of campus buildings and designing future interventions.
Conclusions of the thermal imaging action performed with the thermal camera FLIR VUE PRO R (UAV)
The scanning showed that there are no large areas with significant heat loss on the roof frames of the analyzed buildings. The most significant heat loss was in a roof area at dormitory 23C. The technical team recommended checking the area and repairing it. In the other areas, with thermal leaks of 1–2 degrees Celsius, intervention can be made to reduce them by applying cotton wool insulation on the inside of the roof, thus contributing to the overall improvement of the energy efficiency of the structure.
Terrestrial laser scanning and data processing process.
The technical team processed the data acquired in the field and obtained the final products from terrestrial laser scanning with two specific software: Z+F LaserControl and CloudCompare. The Z+F LaserControl allowed for generating point clouds. Their coloring in RGB format was also generated and temperature attributes specific to each point were added, as can be seen from the figure below.
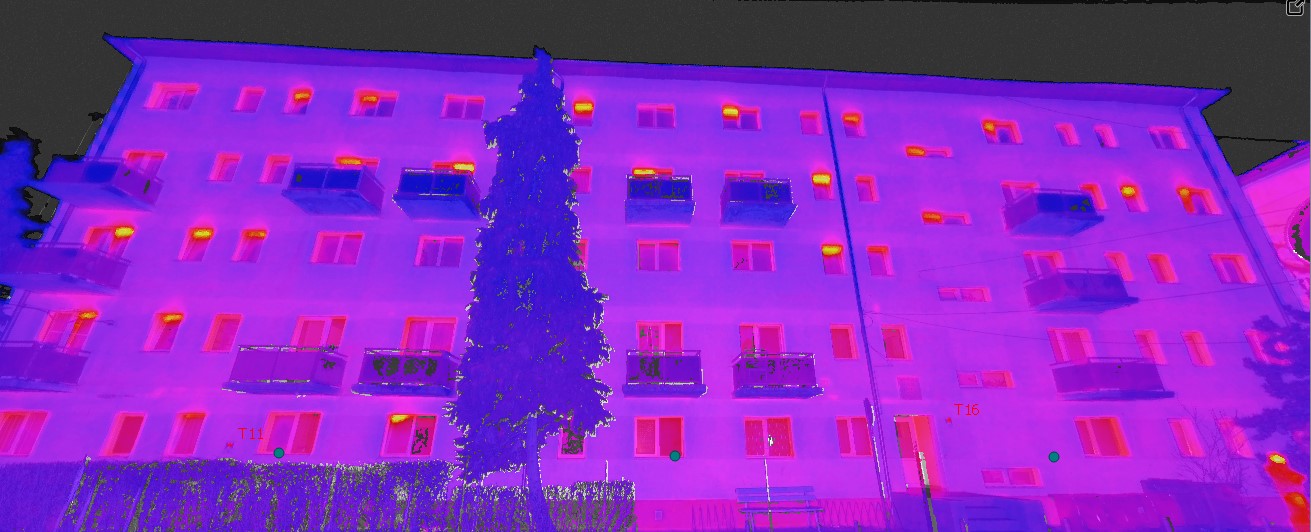
Figure 1. Facade with temperature attributes obtained from final processing
For each dormitory, scans were made by performing multiple stops so that all the details of the building could be captured, resulting in between 6 and 11 scans for each building. For georeferencing point clouds and translating them into a unitary system, fixed targets were used and measured using the Leica TCR 1205 R400 total station. The technical team made sure that at least 3 targets were measured for each scanning station, so as to ensure a good alignment on all three dimensions X, Y, Z and the possibility of additional checks.
Conclusions of thermal scanning actions
Following the scanning process and the detailed analysis of the point clouds obtained both in RGB format and with temperature attributes, the following aspects were highlighted:
• Heat losses within all scanned objectives have low values and are unitary, being mainly caused by thermal losses at the level of the building foundation, door, and window gaps.
• A greater loss of heat in the area of the foundation can be explained by several factors. The foundation is in direct contact with the ground, which may have a lower temperature than the temperature inside the building. Also, the foundation can suffer heat loss through convection and thermal conduction.
To reduce these heat losses and contribute to energy efficiency, the following measures can be taken:
• Thermal insulation of the foundation: Adding a layer of thermal insulation around the foundation can help reduce heat loss. Insulating materials such as polyurethane foam or expanded polystyrene can be used to create a thermal barrier between the foundation and the ground.
• Underground insulation systems: Underground insulation systems consisting of special insulating materials or piping systems that reduce heat transfer between the foundation and the ground can be used.
• Proper ventilation: Good ventilation under the floor can help maintain a constant temperature and prevent moisture buildup, which can contribute to heat loss.
• Assessment and repair of cracks: Any cracks or crevices in the foundation can allow significant heat loss. It is important to conduct regular inspections and perform the necessary repairs.
• Underfloor heating systems: The use of underfloor heating systems can help maintain a more constant temperature inside the building, helping to reduce the need for foundation heating.
• By implementing these measures, heat loss at foundation level can be reduced and a significant contribution can be made to improving the energy efficiency of the building.
• When the windows are closed, heat loss can be observed especially in the upper areas, but also in the lower areas in situations where the radiators were operating:
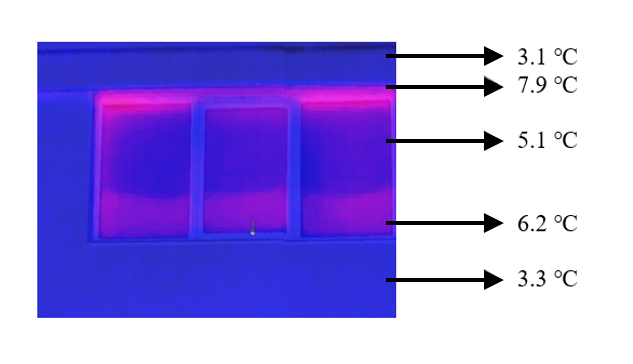
Figure 2. Example of heat loss when the windows are closed.
When the windows were open, the temperature differences between the wall area and the glazing were significantly greater:
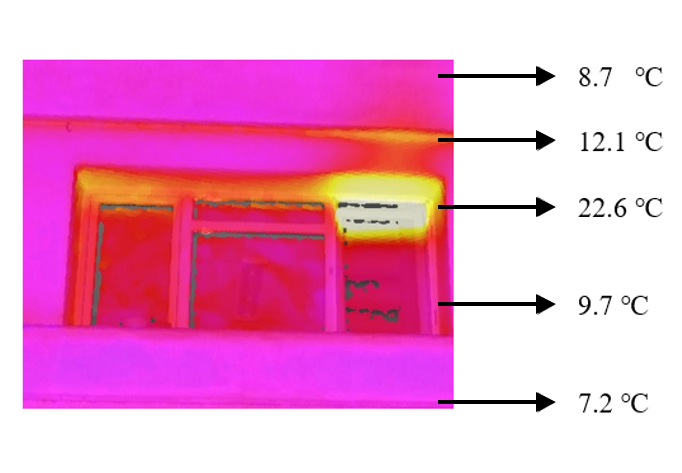
Figure 3. Example of heat loss when windows are open.
The heat losses were similar on the long and short sides of the dormitories, the temperatures varying only depending on the ambient temperature that changed during the measurements. However, one can observe in detail the areas where heat loss occurs. A special case could be seen on the west side of the 22C dormitory, with exposed brick elements on the façade. In this area, higher heat losses can be observed compared to areas with insulation, with heat losses especially in the area of the slabs between floors, but also on a large area in the basement / foundation area:
Also, heat losses were recorded at the foundation level, this observation being valid for all scanned dormitories.
All the presented data can be analyzed in detail with the help of the open program CloudCompare, which is a software specialized in visualizing point clouds.
The action of thermoscanning the buildings on the student campus was a useful action for the project and for the university in outlining future actions for adequate insulation of buildings and their foundations, respectively other actions to reduce heat loss. For the coming years, the technical team recommended a periodic repetition of thermoscanning actions to timely correct the energy losses of the buildings on the student campus, which may still occur. It also recommended to extend thermoscanning actions to all buildings of the Politehnica University of Timisoara.

Figure 4. Example of heat loss on the west side of the dormitory 22 C
In addition to the technical diagnosis, thanks to which an intervention plan can be made for the building enveloping, a significant method of reducing the carbon footprint of the campus, also revealed by the specialized literature, is to change the used energy source. In 2024, UPT accessed a project financed from the funds of the Ministry of Energy, aimed at installing a photovoltaic system at 17 buildings of the Politehnica University of Timișoara (student dormitories, faculty buildings, administrative buildings), with an installed capacity of 1.5 MWh. The path to ensuring the sustainability of the campus is ready, in all its components.
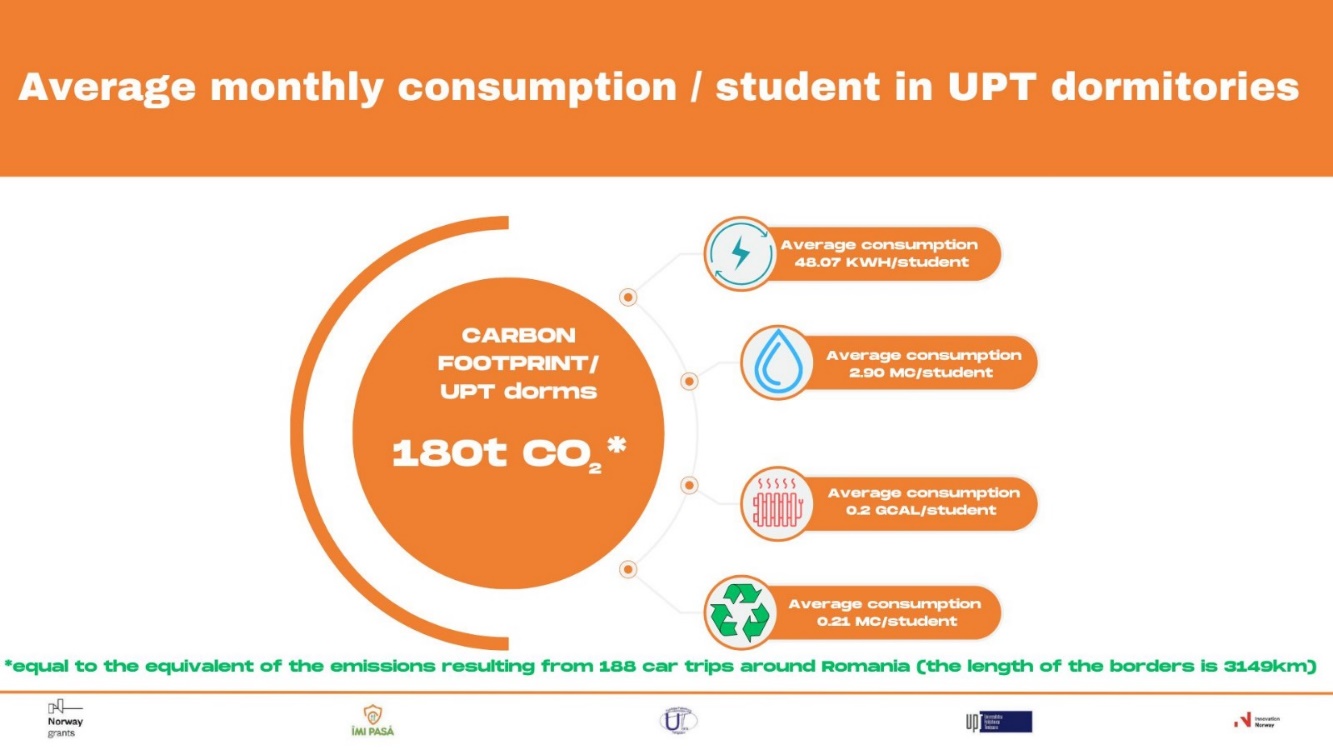
Figure 1. Average monthly consumption per student on UPT campus